29
/pt/
pt
AIzaSyAYiBZKx7MnpbEhh9jyipgxe19OcubqV5w
April 1, 2024
245397
South Africa
ZAF
true
2
1
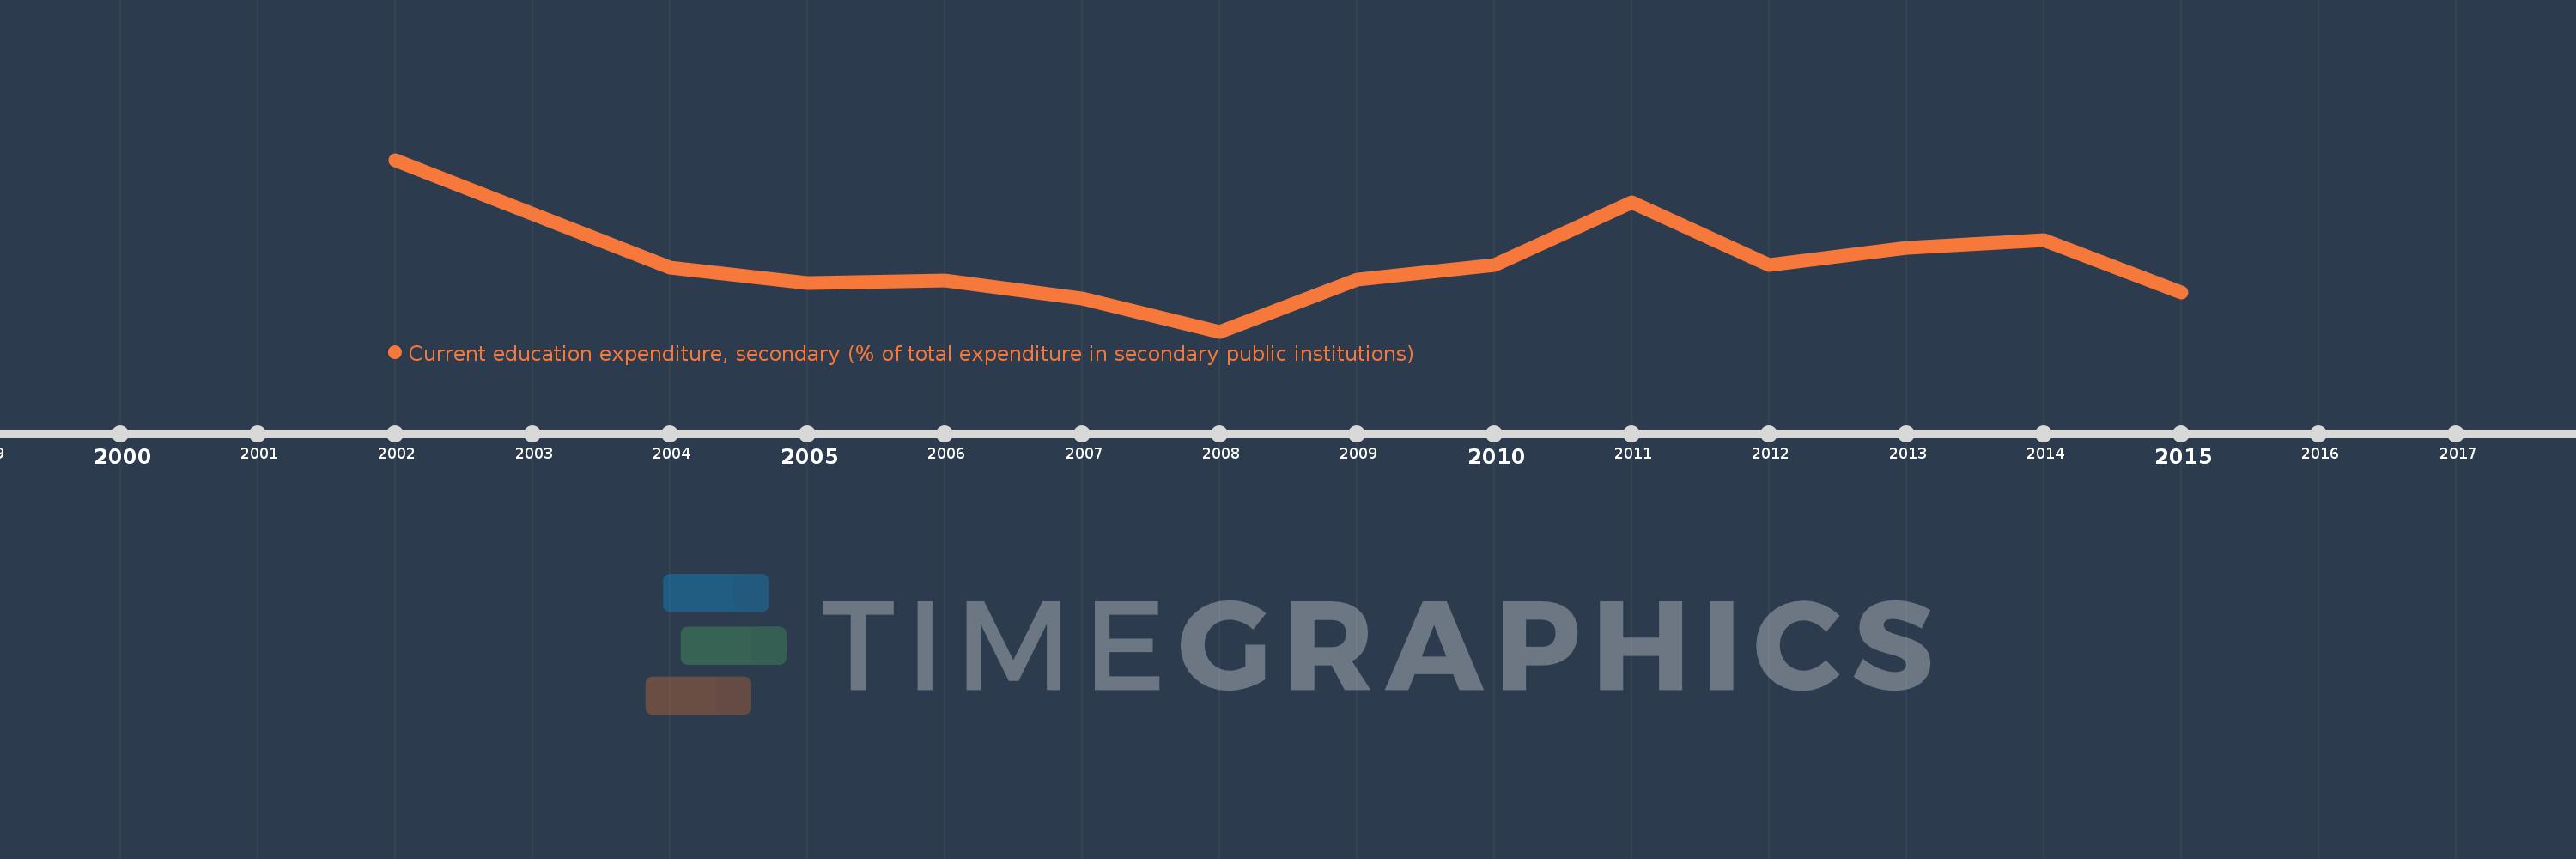
Current education expenditure, secondary (% of total expenditure in secondary public institutions)
2015,2014,2013,2012,2011,2010,2009,2008,2007,2006,2005,2004,2002
Estas estatísticas em outros países:
Linha do tempo:
Nesta escala de tempo está apresentado um gráfico de 2002 ano até 2015 ano South Africa. Dados de 2001 ano ausente. O número de observações reais por data: 13.
Fonte (nome):
Indicadores de desenvolvimento mundial
Fonte (organização):
United Nations Educational, Scientific, and Cultural Organization (UNESCO) Institute for Statistics.
Categorias:
Education
Foi atualizado:
23 abr 2017 ano
Indicadores de alterações dos valores ao longo dos anos
Mínimo:
95.108
1 jan 2008 ano
Máximo:
101.615
1 jan 2002 ano
Na data de observação
Valor
Mudança absoluta
A alteração em relação ao valor anterior
1 jan 2002 ano
101.615
+101.615
0.0%
1 jan 2004 ano
97.546
-4.069
-4.0%
1 jan 2005 ano
96.931
-0.615
-0.63%
1 jan 2006 ano
97.036
+0.106
0.11%
1 jan 2007 ano
96.357
-0.679
-0.7%
1 jan 2008 ano
95.108
-1.248
-1.3%
1 jan 2009 ano
97.087
+1.979
2.08%
1 jan 2010 ano
97.638
+0.55
0.57%
1 jan 2011 ano
100.0
+2.362
2.42%
1 jan 2012 ano
97.627
-2.373
-2.37%
1 jan 2013 ano
98.278
+0.651
0.67%
1 jan 2014 ano
98.582
+0.304
0.31%
1 jan 2015 ano
96.602
-1.979
-2.01%
Classificação de países por estatísticas atuais por anos


Comentários: