29
/pt/
pt
AIzaSyAYiBZKx7MnpbEhh9jyipgxe19OcubqV5w
April 1, 2024
207784
Netherlands
NLD
true
2
1
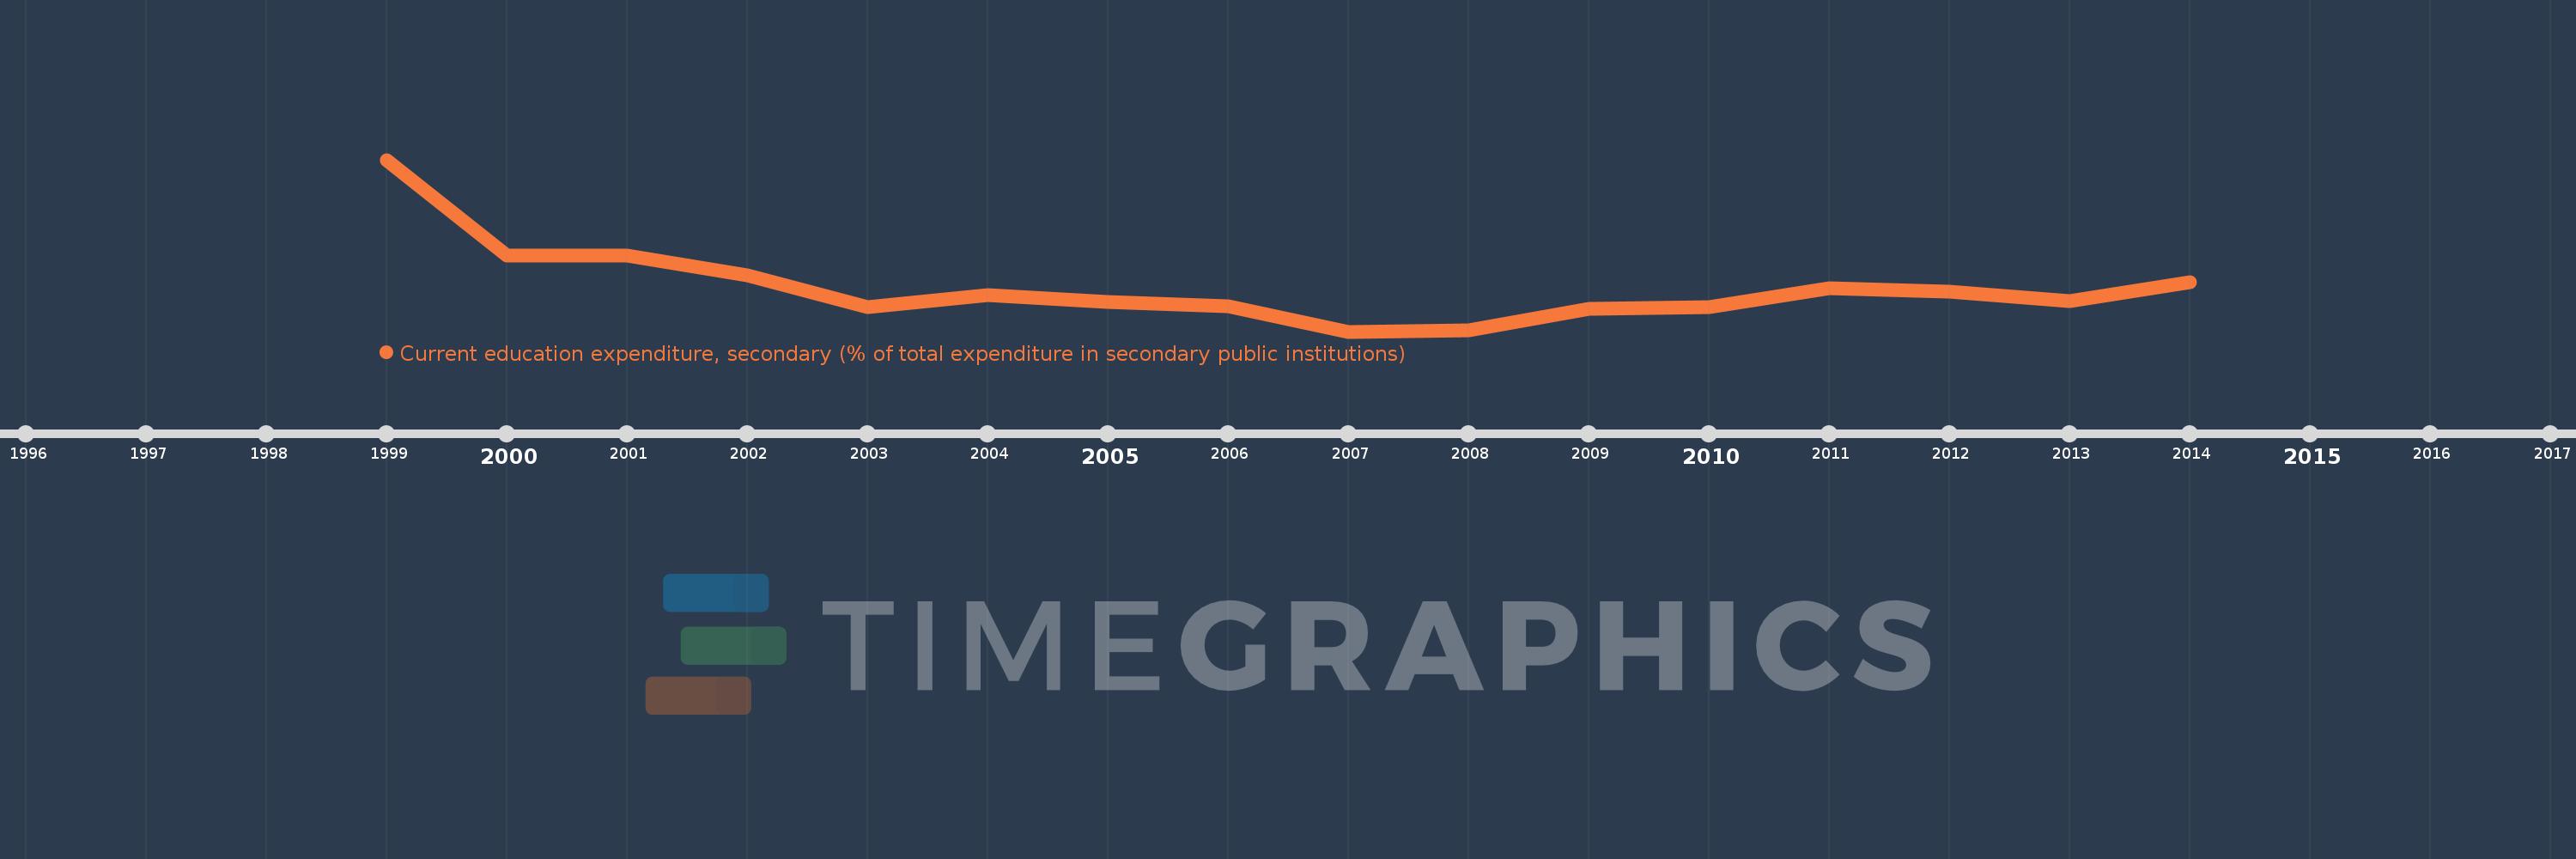
Current education expenditure, secondary (% of total expenditure in secondary public institutions)
2014,2013,2012,2011,2010,2009,2008,2007,2006,2005,2004,2003,2002,2001,2000,1999
Estas estatísticas em outros países:
Linha do tempo:
Nesta escala de tempo está apresentado um gráfico de 1999 ano até 2014 ano Netherlands. Dados de 1998 ano ausente. O número de observações reais por data: 16.
Fonte (nome):
Indicadores de desenvolvimento mundial
Fonte (organização):
United Nations Educational, Scientific, and Cultural Organization (UNESCO) Institute for Statistics.
Categorias:
Education
Foi atualizado:
23 abr 2017 ano
Indicadores de alterações dos valores ao longo dos anos
Mínimo:
84.645
1 jan 2007 ano
Máximo:
94.174
1 jan 1999 ano
Na data de observação
Valor
Mudança absoluta
A alteração em relação ao valor anterior
1 jan 1999 ano
94.174
+94.174
0.0%
1 jan 2000 ano
88.844
-5.33
-5.66%
1 jan 2001 ano
88.857
+0.013
0.01%
1 jan 2002 ano
87.746
-1.111
-1.25%
1 jan 2003 ano
85.982
-1.764
-2.01%
1 jan 2004 ano
86.647
+0.664
0.77%
1 jan 2005 ano
86.288
-0.359
-0.41%
1 jan 2006 ano
86.05
-0.238
-0.28%
1 jan 2007 ano
84.645
-1.404
-1.63%
1 jan 2008 ano
84.722
+0.077
0.09%
1 jan 2009 ano
85.915
+1.193
1.41%
1 jan 2010 ano
85.995
+0.08
0.09%
1 jan 2011 ano
87.051
+1.056
1.23%
1 jan 2012 ano
86.862
-0.189
-0.22%
1 jan 2013 ano
86.353
-0.51
-0.59%
1 jan 2014 ano
87.389
+1.036
1.2%
Classificação de países por estatísticas atuais por anos


Comentários: