29
/pt/
pt
AIzaSyAYiBZKx7MnpbEhh9jyipgxe19OcubqV5w
April 1, 2024
243302
Solomon Islands
SLB
true
2
1
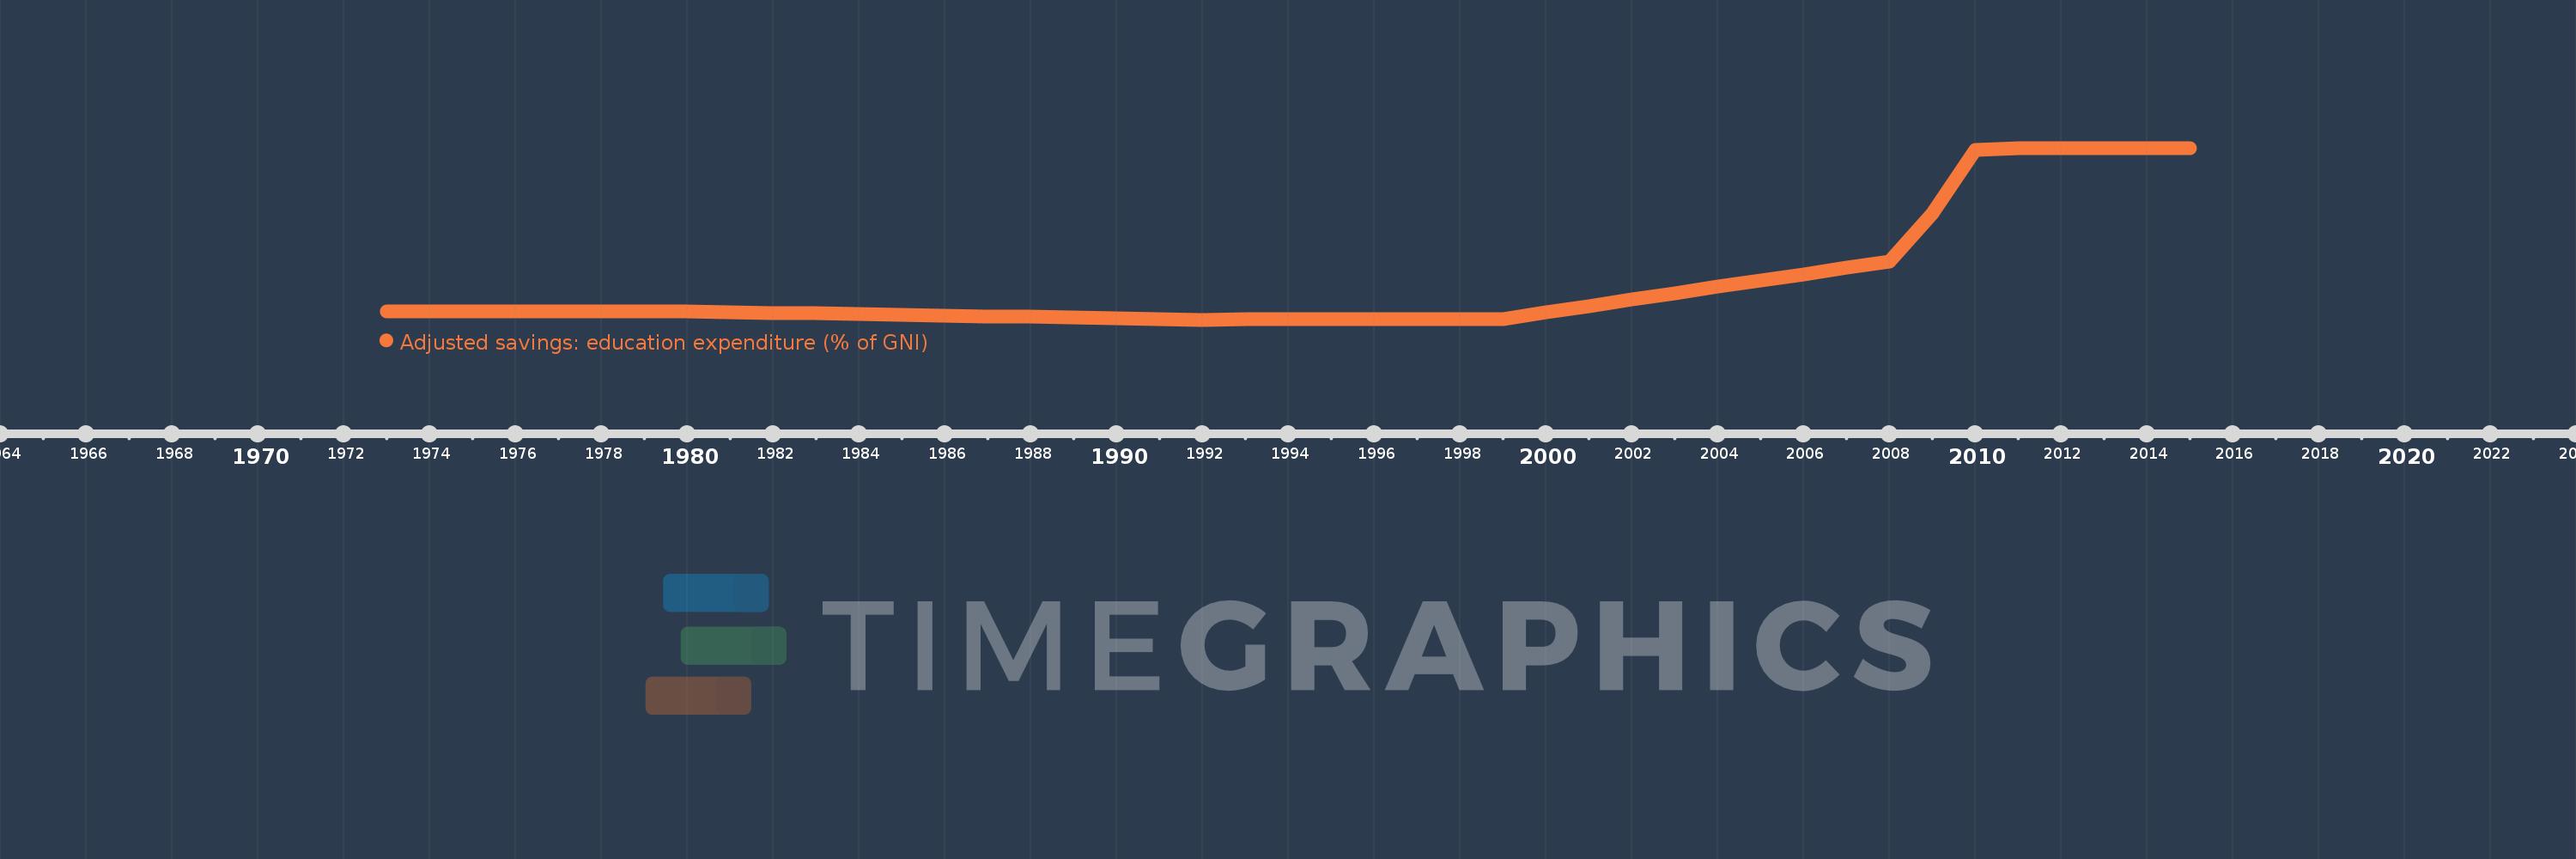
Adjusted savings: education expenditure (% of GNI)
2015,2014,2013,2012,2011,2010,2009,2008,2007,2006,2005,2004,2003,2002,2001,2000,1999,1998,1997,1996,1995,1994,1993,1992,1991,1990,1989,1988,1987,1986,1985,1984,1983,1982,1981,1980,1979,1978,1977,1976,1975,1974,1973
Estas estatísticas em outros países:
AfghanistanAlbaniaAlgeriaAmerican SamoaAndorraAngolaAntigua and BarbudaArab WorldArgentinaArmeniaAustraliaAustriaAzerbaijanBahamas, TheBahrainBangladeshBarbadosBelarusBelgiumBelizeBeninBermudaBhutanBoliviaBotswanaBrazilBrunei DarussalamBulgariaBurkina FasoBurundiCabo VerdeCambodiaCameroonCanadaCaribbean small statesCentral African RepublicCentral Europe and the BalticsChadChileChinaColombiaComorosCongo, Dem. Rep.Congo, Rep.Costa RicaCote d'IvoireCroatiaCubaCyprusCzech RepublicDenmarkDjiboutiDominicaDominican RepublicEarly-demographic dividendEast Asia & PacificEast Asia & Pacific (excluding high income)East Asia & Pacific (IDA & IBRD countries)EcuadorEgypt, Arab Rep.El SalvadorEquatorial GuineaEritreaEstoniaEthiopiaEuro areaEurope & Central AsiaEurope & Central Asia (excluding high income)Europe & Central Asia (IDA & IBRD countries)European UnionFijiFinlandFragile and conflict affected situationsFranceFrench PolynesiaGabonGambia, TheGeorgiaGermanyGhanaGreeceGrenadaGuatemalaGuineaGuinea-BissauGuyanaHaitiHeavily indebted poor countries (HIPC)High incomeHondurasHong Kong SAR, ChinaHungaryIBRD onlyIcelandIDA & IBRD totalIDA blendIDA onlyIDA totalIndiaIndonesiaIran, Islamic Rep.IraqIrelandIsraelItalyJamaicaJapanJordanKazakhstanKenyaKiribatiKorea, Rep.KuwaitKyrgyz RepublicLao PDRLate-demographic dividendLatin America & Caribbean Latin America & Caribbean (excluding high income)Latin America & the Caribbean (IDA & IBRD countries)LatviaLeast developed countries: UN classificationLebanonLesothoLiberiaLibyaLiechtensteinLithuaniaLow & middle incomeLow incomeLower middle incomeLuxembourgMacao SAR, ChinaMacedonia, FYRMadagascarMalawiMalaysiaMaldivesMaliMaltaMarshall IslandsMauritaniaMauritiusMexicoMicronesia, Fed. Sts.Middle East & North AfricaMiddle East & North Africa (excluding high income)Middle East & North Africa (IDA & IBRD countries)Middle incomeMoldovaMonacoMongoliaMoroccoMozambiqueMyanmarNamibiaNepalNetherlandsNew CaledoniaNew ZealandNicaraguaNigerNigeriaNorth AmericaNorwayOECD membersOmanOther small statesPacific island small statesPakistanPanamaPapua New GuineaParaguayPeruPhilippinesPolandPortugalPost-demographic dividendPre-demographic dividendPuerto RicoQatarRomaniaRussian FederationRwandaSamoaSan MarinoSao Tome and PrincipeSaudi ArabiaSenegalSerbiaSeychellesSierra LeoneSingaporeSlovak RepublicSloveniaSmall statesSolomon IslandsSomaliaSouth AfricaSouth AsiaSouth Asia (IDA & IBRD)SpainSri LankaSt. Kitts and NevisSt. LuciaSt. Vincent and the GrenadinesSub-Saharan Africa Sub-Saharan Africa (excluding high income)Sub-Saharan Africa (IDA & IBRD countries)SudanSurinameSwazilandSwedenSwitzerlandSyrian Arab RepublicTajikistanTanzaniaThailandTimor-LesteTogoTongaTrinidad and TobagoTunisiaTurkeyTurkmenistanUgandaUkraineUnited KingdomUnited StatesUpper middle incomeUruguayUzbekistanVanuatuVenezuela, RBVietnamVirgin Islands (U.S.)WorldYemen, Rep.ZambiaZimbabwe Linha do tempo:
Nesta escala de tempo está apresentado um gráfico de 1973 ano até 2015 ano Solomon Islands. Dados de 1972 ano ausente. O número de observações reais por data: 43.
Fonte (nome):
Indicadores de desenvolvimento mundial
Fonte (organização):
World Bank staff estimates using data from the United Nations Statistics Division's Statistical Yearbook, and the UNESCO Institute for Statistics online database.
Categorias:
Economy & Growth, Environment
Foi atualizado:
23 abr 2017 ano
Indicadores de alterações dos valores ao longo dos anos
Máximo:
9.94
1 jan 2011 ano
Na data de observação
Valor
Mudança absoluta
A alteração em relação ao valor anterior
1 jan 1973 ano
4.1
+4.1
0.0%
1 jan 1974 ano
4.1
0.0
0.0%
1 jan 1975 ano
4.1
0.0
0.0%
1 jan 1976 ano
4.1
0.0
0.0%
1 jan 1977 ano
4.1
0.0
0.0%
1 jan 1978 ano
4.1
0.0
0.0%
1 jan 1979 ano
4.1
0.0
0.0%
1 jan 1980 ano
4.1
0.0
0.0%
1 jan 1981 ano
4.075
-0.025
-0.61%
1 jan 1982 ano
4.05
-0.025
-0.61%
1 jan 1983 ano
4.025
-0.025
-0.62%
1 jan 1984 ano
4.0
-0.025
-0.62%
1 jan 1985 ano
3.975
-0.025
-0.62%
1 jan 1986 ano
3.95
-0.025
-0.63%
1 jan 1987 ano
3.925
-0.025
-0.63%
1 jan 1988 ano
3.9
-0.025
-0.64%
1 jan 1989 ano
3.875
-0.025
-0.64%
1 jan 1990 ano
3.85
-0.025
-0.65%
1 jan 1991 ano
3.825
-0.025
-0.65%
1 jan 1992 ano
3.8
-0.025
-0.65%
1 jan 1993 ano
3.831
+0.031
0.81%
1 jan 1994 ano
3.831
0.0
0.0%
1 jan 1995 ano
3.831
0.0
0.0%
1 jan 1996 ano
3.831
0.0
0.0%
1 jan 1997 ano
3.831
0.0
0.0%
1 jan 1998 ano
3.831
0.0
0.0%
1 jan 1999 ano
3.831
0.0
0.0%
1 jan 2000 ano
4.06
+0.229
5.97%
1 jan 2001 ano
4.288
+0.229
5.64%
1 jan 2002 ano
4.517
+0.229
5.34%
1 jan 2003 ano
4.746
+0.229
5.07%
1 jan 2004 ano
4.975
+0.229
4.82%
1 jan 2005 ano
5.204
+0.229
4.6%
1 jan 2006 ano
5.432
+0.229
4.4%
1 jan 2007 ano
5.661
+0.229
4.21%
1 jan 2008 ano
5.89
+0.229
4.04%
1 jan 2009 ano
7.6
+1.71
29.03%
1 jan 2010 ano
9.86
+2.26
29.74%
1 jan 2011 ano
9.94
+0.08
0.81%
1 jan 2012 ano
9.94
0.0
0.0%
1 jan 2013 ano
9.94
0.0
0.0%
1 jan 2014 ano
9.94
0.0
0.0%
1 jan 2015 ano
9.94
0.0
0.0%
Classificação de países por estatísticas atuais por anos


Comentários: