29
/pt/
pt
AIzaSyAYiBZKx7MnpbEhh9jyipgxe19OcubqV5w
April 1, 2024
151307
Hong Kong SAR, China
HKG
true
2
1
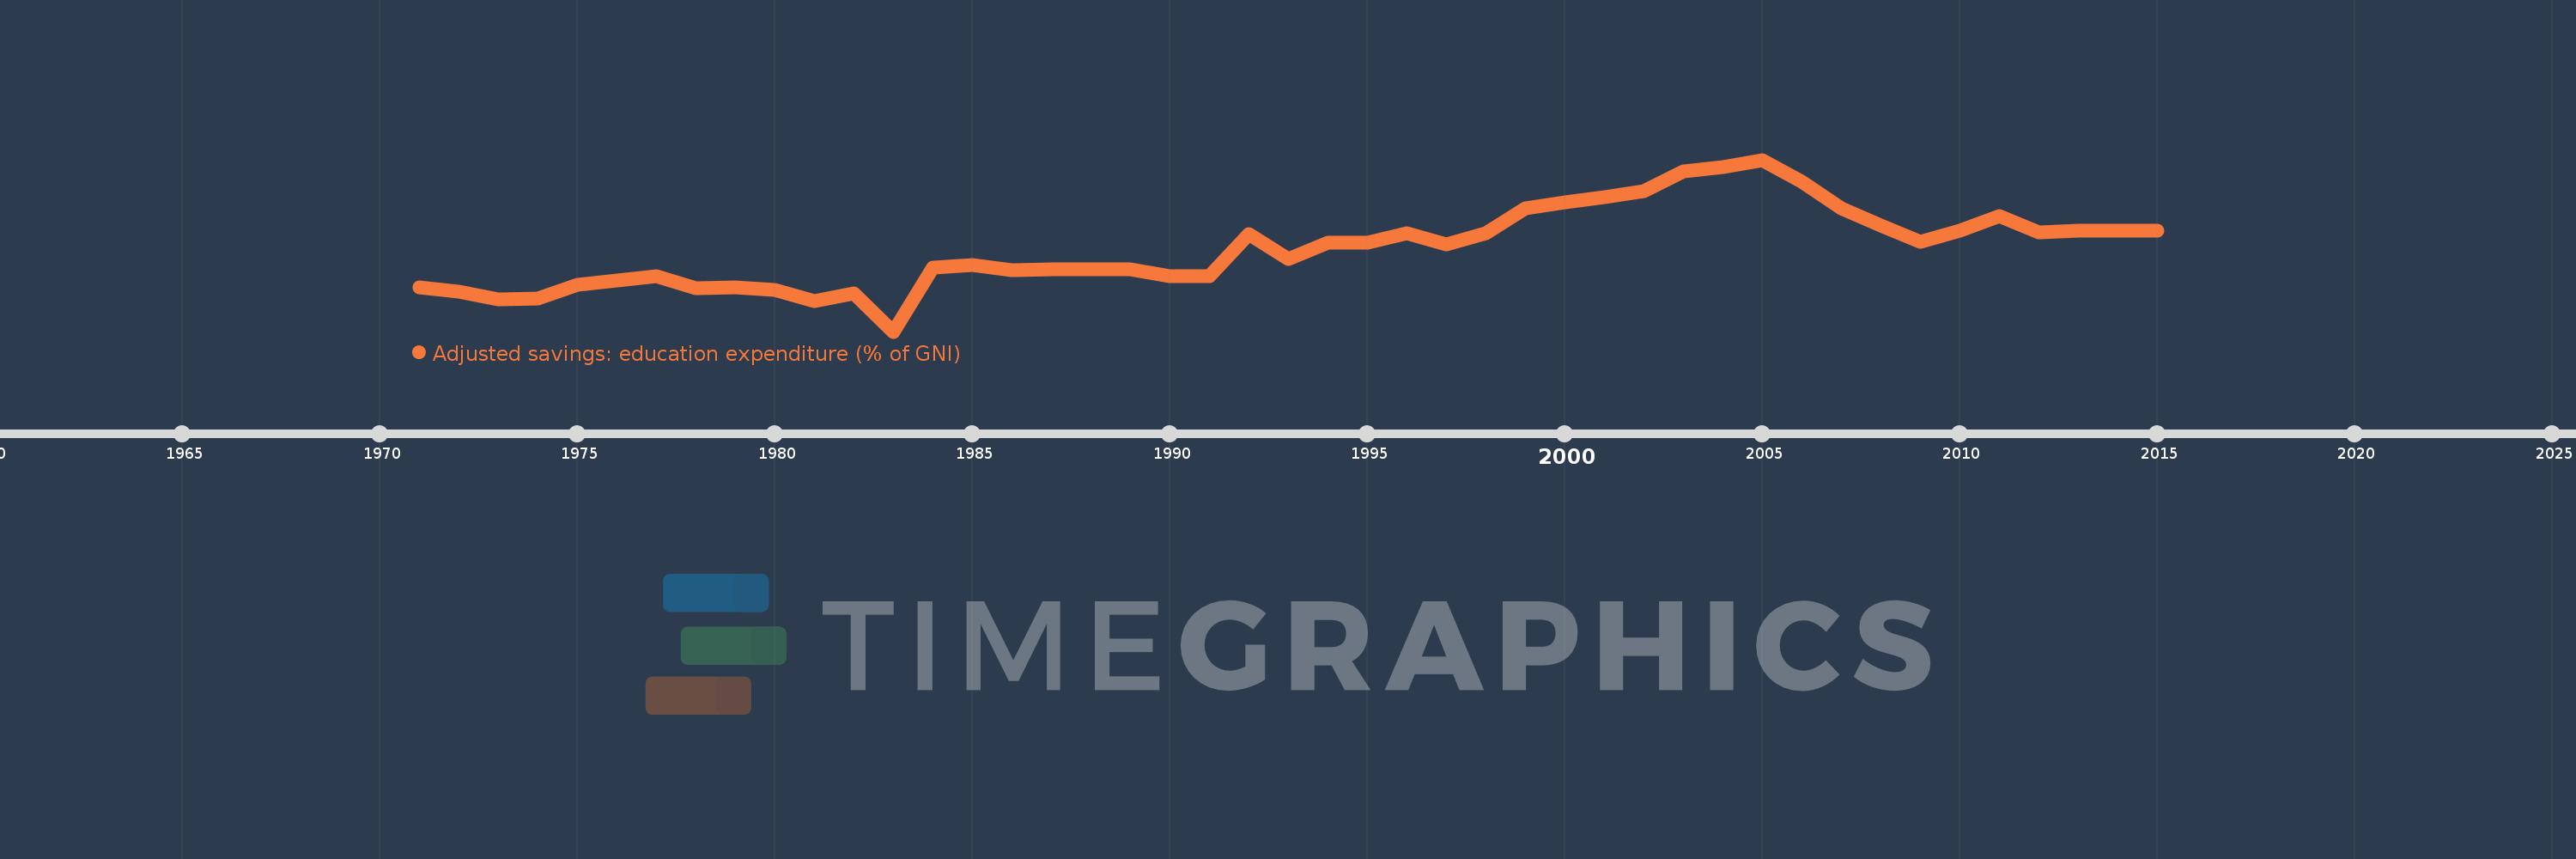
Adjusted savings: education expenditure (% of GNI)
2015,2014,2013,2012,2011,2010,2009,2008,2007,2006,2005,2004,2003,2002,2001,2000,1999,1998,1997,1996,1995,1994,1993,1992,1991,1990,1989,1988,1987,1986,1985,1984,1983,1982,1981,1980,1979,1978,1977,1976,1975,1974,1973,1972,1971
Estas estatísticas em outros países:
AfghanistanAlbaniaAlgeriaAmerican SamoaAndorraAngolaAntigua and BarbudaArab WorldArgentinaArmeniaAustraliaAustriaAzerbaijanBahamas, TheBahrainBangladeshBarbadosBelarusBelgiumBelizeBeninBermudaBhutanBoliviaBotswanaBrazilBrunei DarussalamBulgariaBurkina FasoBurundiCabo VerdeCambodiaCameroonCanadaCaribbean small statesCentral African RepublicCentral Europe and the BalticsChadChileChinaColombiaComorosCongo, Dem. Rep.Congo, Rep.Costa RicaCote d'IvoireCroatiaCubaCyprusCzech RepublicDenmarkDjiboutiDominicaDominican RepublicEarly-demographic dividendEast Asia & PacificEast Asia & Pacific (excluding high income)East Asia & Pacific (IDA & IBRD countries)EcuadorEgypt, Arab Rep.El SalvadorEquatorial GuineaEritreaEstoniaEthiopiaEuro areaEurope & Central AsiaEurope & Central Asia (excluding high income)Europe & Central Asia (IDA & IBRD countries)European UnionFijiFinlandFragile and conflict affected situationsFranceFrench PolynesiaGabonGambia, TheGeorgiaGermanyGhanaGreeceGrenadaGuatemalaGuineaGuinea-BissauGuyanaHaitiHeavily indebted poor countries (HIPC)High incomeHondurasHong Kong SAR, ChinaHungaryIBRD onlyIcelandIDA & IBRD totalIDA blendIDA onlyIDA totalIndiaIndonesiaIran, Islamic Rep.IraqIrelandIsraelItalyJamaicaJapanJordanKazakhstanKenyaKiribatiKorea, Rep.KuwaitKyrgyz RepublicLao PDRLate-demographic dividendLatin America & Caribbean Latin America & Caribbean (excluding high income)Latin America & the Caribbean (IDA & IBRD countries)LatviaLeast developed countries: UN classificationLebanonLesothoLiberiaLibyaLiechtensteinLithuaniaLow & middle incomeLow incomeLower middle incomeLuxembourgMacao SAR, ChinaMacedonia, FYRMadagascarMalawiMalaysiaMaldivesMaliMaltaMarshall IslandsMauritaniaMauritiusMexicoMicronesia, Fed. Sts.Middle East & North AfricaMiddle East & North Africa (excluding high income)Middle East & North Africa (IDA & IBRD countries)Middle incomeMoldovaMonacoMongoliaMoroccoMozambiqueMyanmarNamibiaNepalNetherlandsNew CaledoniaNew ZealandNicaraguaNigerNigeriaNorth AmericaNorwayOECD membersOmanOther small statesPacific island small statesPakistanPanamaPapua New GuineaParaguayPeruPhilippinesPolandPortugalPost-demographic dividendPre-demographic dividendPuerto RicoQatarRomaniaRussian FederationRwandaSamoaSan MarinoSao Tome and PrincipeSaudi ArabiaSenegalSerbiaSeychellesSierra LeoneSingaporeSlovak RepublicSloveniaSmall statesSolomon IslandsSomaliaSouth AfricaSouth AsiaSouth Asia (IDA & IBRD)SpainSri LankaSt. Kitts and NevisSt. LuciaSt. Vincent and the GrenadinesSub-Saharan Africa Sub-Saharan Africa (excluding high income)Sub-Saharan Africa (IDA & IBRD countries)SudanSurinameSwazilandSwedenSwitzerlandSyrian Arab RepublicTajikistanTanzaniaThailandTimor-LesteTogoTongaTrinidad and TobagoTunisiaTurkeyTurkmenistanUgandaUkraineUnited KingdomUnited StatesUpper middle incomeUruguayUzbekistanVanuatuVenezuela, RBVietnamVirgin Islands (U.S.)WorldYemen, Rep.ZambiaZimbabwe Linha do tempo:
Nesta escala de tempo está apresentado um gráfico de 1971 ano até 2015 ano Hong Kong SAR, China. Dados de 1970 ano ausente. O número de observações reais por data: 45.
Fonte (nome):
Indicadores de desenvolvimento mundial
Fonte (organização):
World Bank staff estimates using data from the United Nations Statistics Division's Statistical Yearbook, and the UNESCO Institute for Statistics online database.
Categorias:
Economy & Growth, Environment
Foi atualizado:
23 abr 2017 ano
Indicadores de alterações dos valores ao longo dos anos
Mínimo:
1.551
1 jan 1983 ano
Máximo:
3.678
1 jan 2005 ano
Na data de observação
Valor
Mudança absoluta
A alteração em relação ao valor anterior
1 jan 1971 ano
2.099
+2.099
0.0%
1 jan 1972 ano
2.047
-0.052
-2.5%
1 jan 1973 ano
1.946
-0.101
-4.93%
1 jan 1974 ano
1.961
+0.015
0.79%
1 jan 1975 ano
2.133
+0.171
8.74%
1 jan 1976 ano
2.18
+0.047
2.21%
1 jan 1977 ano
2.242
+0.062
2.86%
1 jan 1978 ano
2.092
-0.15
-6.68%
1 jan 1979 ano
2.1
+0.008
0.36%
1 jan 1980 ano
2.062
-0.038
-1.83%
1 jan 1981 ano
1.928
-0.134
-6.49%
1 jan 1982 ano
2.019
+0.091
4.73%
1 jan 1983 ano
1.551
-0.468
-23.16%
1 jan 1984 ano
2.339
+0.788
50.78%
1 jan 1985 ano
2.377
+0.038
1.62%
1 jan 1986 ano
2.307
-0.07
-2.96%
1 jan 1987 ano
2.324
+0.017
0.75%
1 jan 1988 ano
2.324
0.0
0.0%
1 jan 1989 ano
2.324
0.0
0.0%
1 jan 1990 ano
2.235
-0.089
-3.83%
1 jan 1991 ano
2.234
-0.001
-0.04%
1 jan 1992 ano
2.754
+0.519
23.24%
1 jan 1993 ano
2.452
-0.302
-10.96%
1 jan 1994 ano
2.651
+0.2
8.14%
1 jan 1995 ano
2.651
0.0
0.0%
1 jan 1996 ano
2.772
+0.12
4.54%
1 jan 1997 ano
2.627
-0.144
-5.21%
1 jan 1998 ano
2.772
+0.144
5.5%
1 jan 1999 ano
3.075
+0.304
10.96%
1 jan 2000 ano
3.147
+0.072
2.33%
1 jan 2001 ano
3.219
+0.072
2.28%
1 jan 2002 ano
3.291
+0.072
2.23%
1 jan 2003 ano
3.536
+0.246
7.46%
1 jan 2004 ano
3.59
+0.054
1.53%
1 jan 2005 ano
3.678
+0.088
2.44%
1 jan 2006 ano
3.408
-0.27
-7.35%
1 jan 2007 ano
3.08
-0.327
-9.61%
1 jan 2008 ano
2.867
-0.213
-6.93%
1 jan 2009 ano
2.664
-0.203
-7.07%
1 jan 2010 ano
2.799
+0.135
5.05%
1 jan 2011 ano
2.986
+0.187
6.7%
1 jan 2012 ano
2.777
-0.209
-6.99%
1 jan 2013 ano
2.804
+0.027
0.96%
1 jan 2014 ano
2.804
0.0
0.0%
1 jan 2015 ano
2.804
0.0
0.0%
Classificação de países por estatísticas atuais por anos


Comentários: