29
/pt/
pt
AIzaSyAYiBZKx7MnpbEhh9jyipgxe19OcubqV5w
April 1, 2024
239463
Sierra Leone
SLE
true
2
1
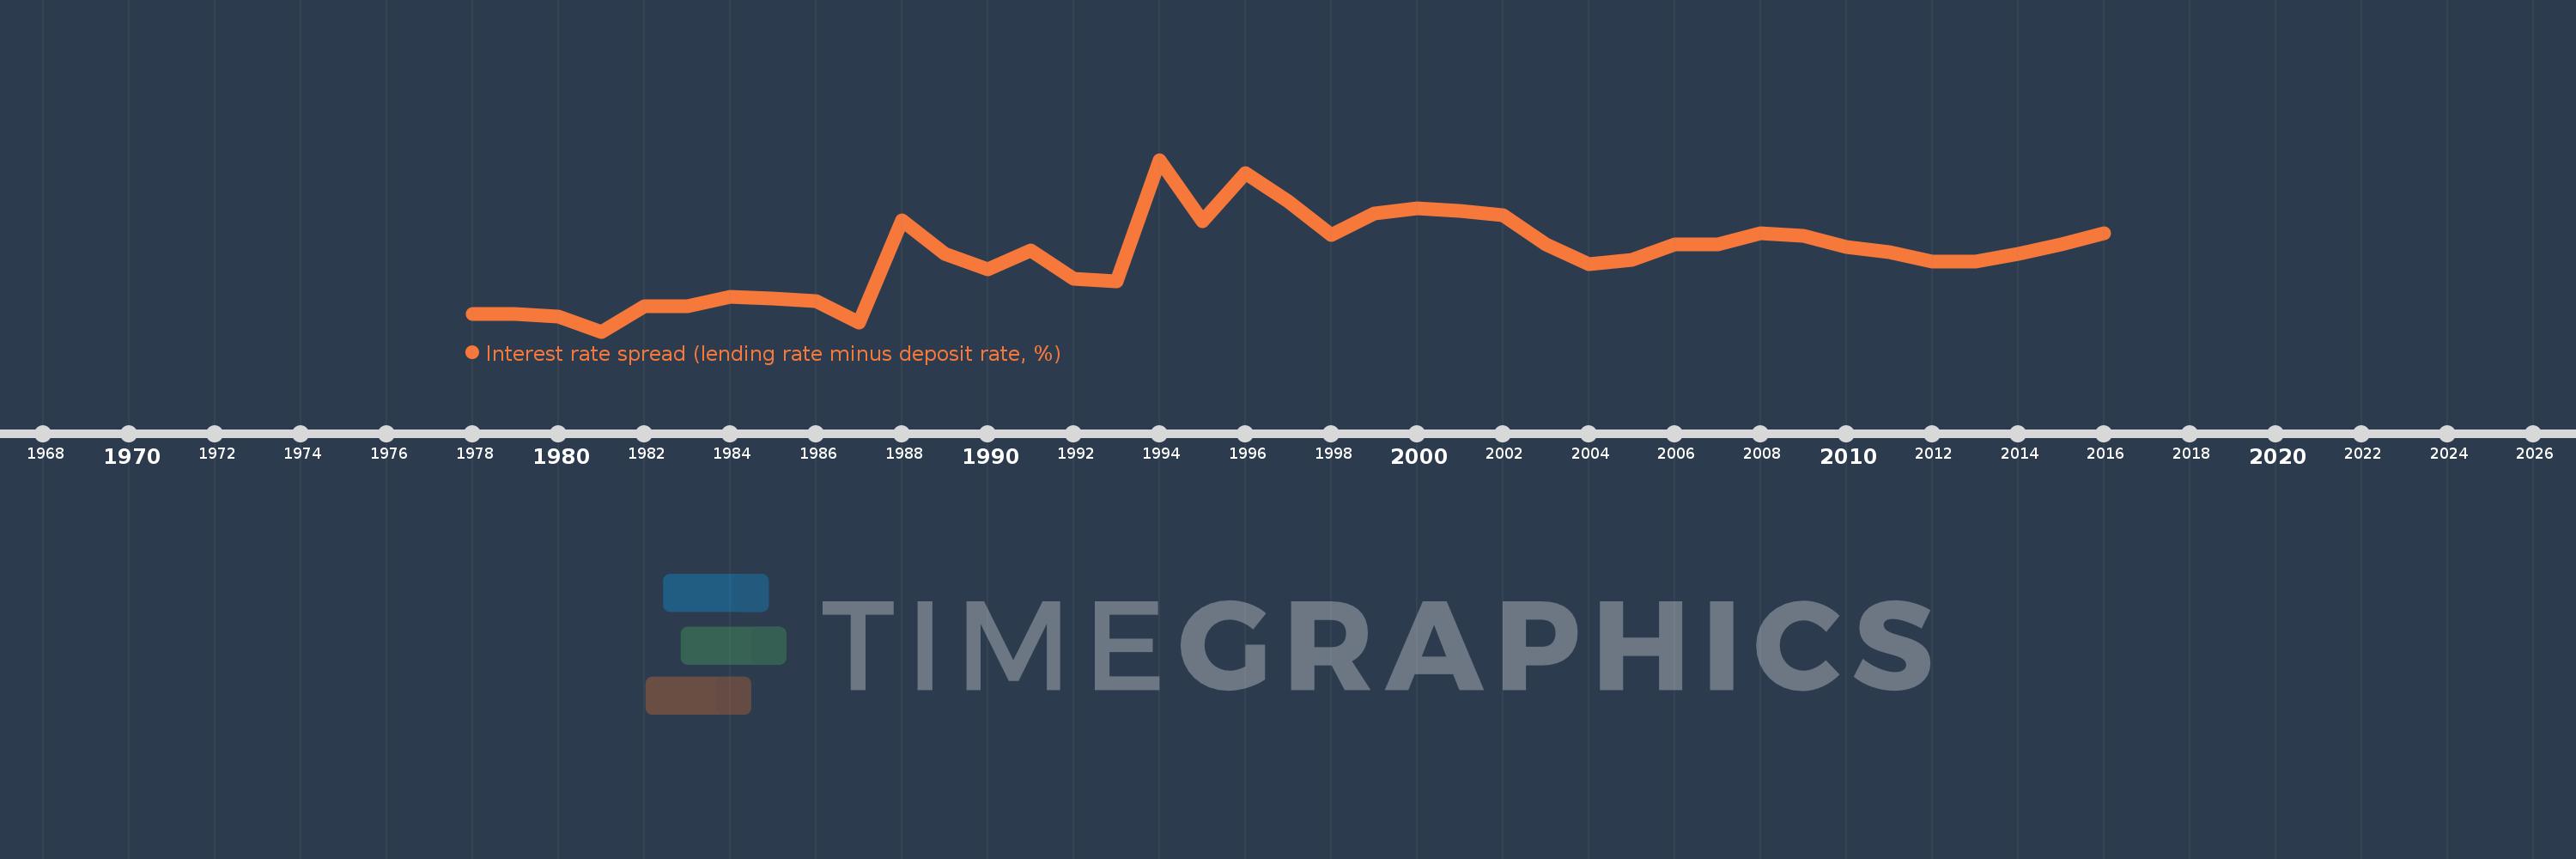
Interest rate spread (lending rate minus deposit rate, %)
2016,2015,2014,2013,2012,2011,2010,2009,2008,2007,2006,2005,2004,2003,2002,2001,2000,1999,1998,1997,1996,1995,1994,1993,1992,1991,1990,1989,1988,1987,1986,1985,1984,1983,1982,1981,1980,1979,1978
Estas estatísticas em outros países:
AlbaniaAlgeriaAngolaAntigua and BarbudaArab WorldArgentinaArmeniaArubaAustraliaAustriaAzerbaijanBahamas, TheBahrainBangladeshBarbadosBelarusBelgiumBelizeBeninBhutanBoliviaBosnia and HerzegovinaBotswanaBrazilBrunei DarussalamBulgariaBurkina FasoBurundiCabo VerdeCameroonCanadaCaribbean small statesCentral African RepublicCentral Europe and the BalticsChadChileChinaColombiaComorosCongo, Dem. Rep.Congo, Rep.Costa RicaCote d'IvoireCroatiaCyprusCzech RepublicDenmarkDjiboutiDominicaDominican RepublicEarly-demographic dividendEast Asia & PacificEast Asia & Pacific (excluding high income)East Asia & Pacific (IDA & IBRD countries)EcuadorEgypt, Arab Rep.Equatorial GuineaEstoniaEthiopiaEuro areaEurope & Central AsiaEurope & Central Asia (excluding high income)Europe & Central Asia (IDA & IBRD countries)European UnionFijiFinlandFragile and conflict affected situationsFranceGabonGambia, TheGeorgiaGermanyGhanaGreeceGrenadaGuatemalaGuineaGuinea-BissauGuyanaHaitiHeavily indebted poor countries (HIPC)High incomeHondurasHong Kong SAR, ChinaHungaryIBRD onlyIcelandIDA & IBRD totalIDA blendIDA onlyIDA totalIndonesiaIran, Islamic Rep.IraqIrelandIsraelItalyJamaicaJapanJordanKenyaKorea, Rep.KosovoKuwaitKyrgyz RepublicLao PDRLate-demographic dividendLatin America & Caribbean Latin America & Caribbean (excluding high income)Latin America & the Caribbean (IDA & IBRD countries)LatviaLeast developed countries: UN classificationLebanonLesothoLiberiaLibyaLithuaniaLow & middle incomeLow incomeLower middle incomeLuxembourgMacao SAR, ChinaMacedonia, FYRMadagascarMalawiMalaysiaMaldivesMaliMaltaMauritaniaMauritiusMexicoMicronesia, Fed. Sts.Middle East & North AfricaMiddle East & North Africa (excluding high income)Middle East & North Africa (IDA & IBRD countries)Middle incomeMoldovaMongoliaMontenegroMoroccoMozambiqueMyanmarNamibiaNepalNetherlandsNew ZealandNicaraguaNigerNigeriaNorwayOECD membersOmanOther small statesPacific island small statesPanamaPapua New GuineaParaguayPeruPhilippinesPolandPortugalPost-demographic dividendPre-demographic dividendQatarRomaniaRussian FederationRwandaSamoaSan MarinoSao Tome and PrincipeSenegalSerbiaSeychellesSierra LeoneSingaporeSlovak RepublicSloveniaSmall statesSolomon IslandsSouth AfricaSouth AsiaSouth Asia (IDA & IBRD)South SudanSpainSri LankaSt. Kitts and NevisSt. LuciaSt. Vincent and the GrenadinesSub-Saharan Africa Sub-Saharan Africa (excluding high income)Sub-Saharan Africa (IDA & IBRD countries)SurinameSwazilandSwedenSwitzerlandSyrian Arab RepublicTajikistanTanzaniaThailandTimor-LesteTogoTongaTrinidad and TobagoTunisiaUgandaUkraineUnited KingdomUpper middle incomeUruguayVanuatuVenezuela, RBVietnamWest Bank and GazaWorldYemen, Rep.ZambiaZimbabwe Linha do tempo:
Nesta escala de tempo está apresentado um gráfico de 1978 ano até 2016 ano Sierra Leone. Dados de 1977 ano ausente. O número de observações reais por data: 39.
Fonte (nome):
Indicadores de desenvolvimento mundial
Fonte (organização):
International Monetary Fund, International Financial Statistics and data files.
Categorias:
Financial Sector
Foi atualizado:
23 abr 2017 ano
Indicadores de alterações dos valores ao longo dos anos
Mínimo:
1.833
1 jan 1981 ano
Máximo:
23.458
1 jan 1994 ano
Na data de observação
Valor
Mudança absoluta
A alteração em relação ao valor anterior
1 jan 1978 ano
4.0
+4.0
0.0%
1 jan 1979 ano
4.0
0.0
0.0%
1 jan 1980 ano
3.75
-0.25
-6.25%
1 jan 1981 ano
1.833
-1.917
-51.11%
1 jan 1982 ano
5.0
+3.167
172.73%
1 jan 1983 ano
5.0
0.0
0.0%
1 jan 1984 ano
6.25
+1.25
25.0%
1 jan 1985 ano
6.0
-0.25
-4.0%
1 jan 1986 ano
5.667
-0.333
-5.56%
1 jan 1987 ano
3.021
-2.646
-46.69%
1 jan 1988 ano
15.875
+12.854
425.52%
1 jan 1989 ano
11.667
-4.208
-26.51%
1 jan 1990 ano
9.667
-2.0
-17.14%
1 jan 1991 ano
12.0
+2.333
24.14%
1 jan 1992 ano
8.45
-3.55
-29.58%
1 jan 1993 ano
8.167
-0.283
-3.35%
1 jan 1994 ano
23.458
+15.292
187.24%
1 jan 1995 ano
15.7
-7.758
-33.07%
1 jan 1996 ano
21.804
+6.104
38.88%
1 jan 1997 ano
18.168
-3.637
-16.68%
1 jan 1998 ano
13.963
-4.205
-23.15%
1 jan 1999 ano
16.71
+2.748
19.68%
1 jan 2000 ano
17.332
+0.622
3.72%
1 jan 2001 ano
17.005
-0.327
-1.88%
1 jan 2002 ano
16.5
-0.505
-2.97%
1 jan 2003 ano
12.771
-3.729
-22.6%
1 jan 2004 ano
10.33
-2.441
-19.11%
1 jan 2005 ano
10.915
+0.585
5.66%
1 jan 2006 ano
12.786
+1.871
17.14%
1 jan 2007 ano
12.86
+0.074
0.58%
1 jan 2008 ano
14.213
+1.353
10.52%
1 jan 2009 ano
13.908
-0.305
-2.15%
1 jan 2010 ano
12.444
-1.463
-10.52%
1 jan 2011 ano
11.783
-0.661
-5.31%
1 jan 2012 ano
10.689
-1.095
-9.29%
1 jan 2013 ano
10.61
-0.079
-0.74%
1 jan 2014 ano
11.651
+1.041
9.81%
1 jan 2015 ano
12.806
+1.155
9.91%
1 jan 2016 ano
14.244
+1.438
11.23%
Classificação de países por estatísticas atuais por anos


Comentários: