29
/pt/
pt
AIzaSyAYiBZKx7MnpbEhh9jyipgxe19OcubqV5w
April 1, 2024
141963
Greece
GRC
true
2
1
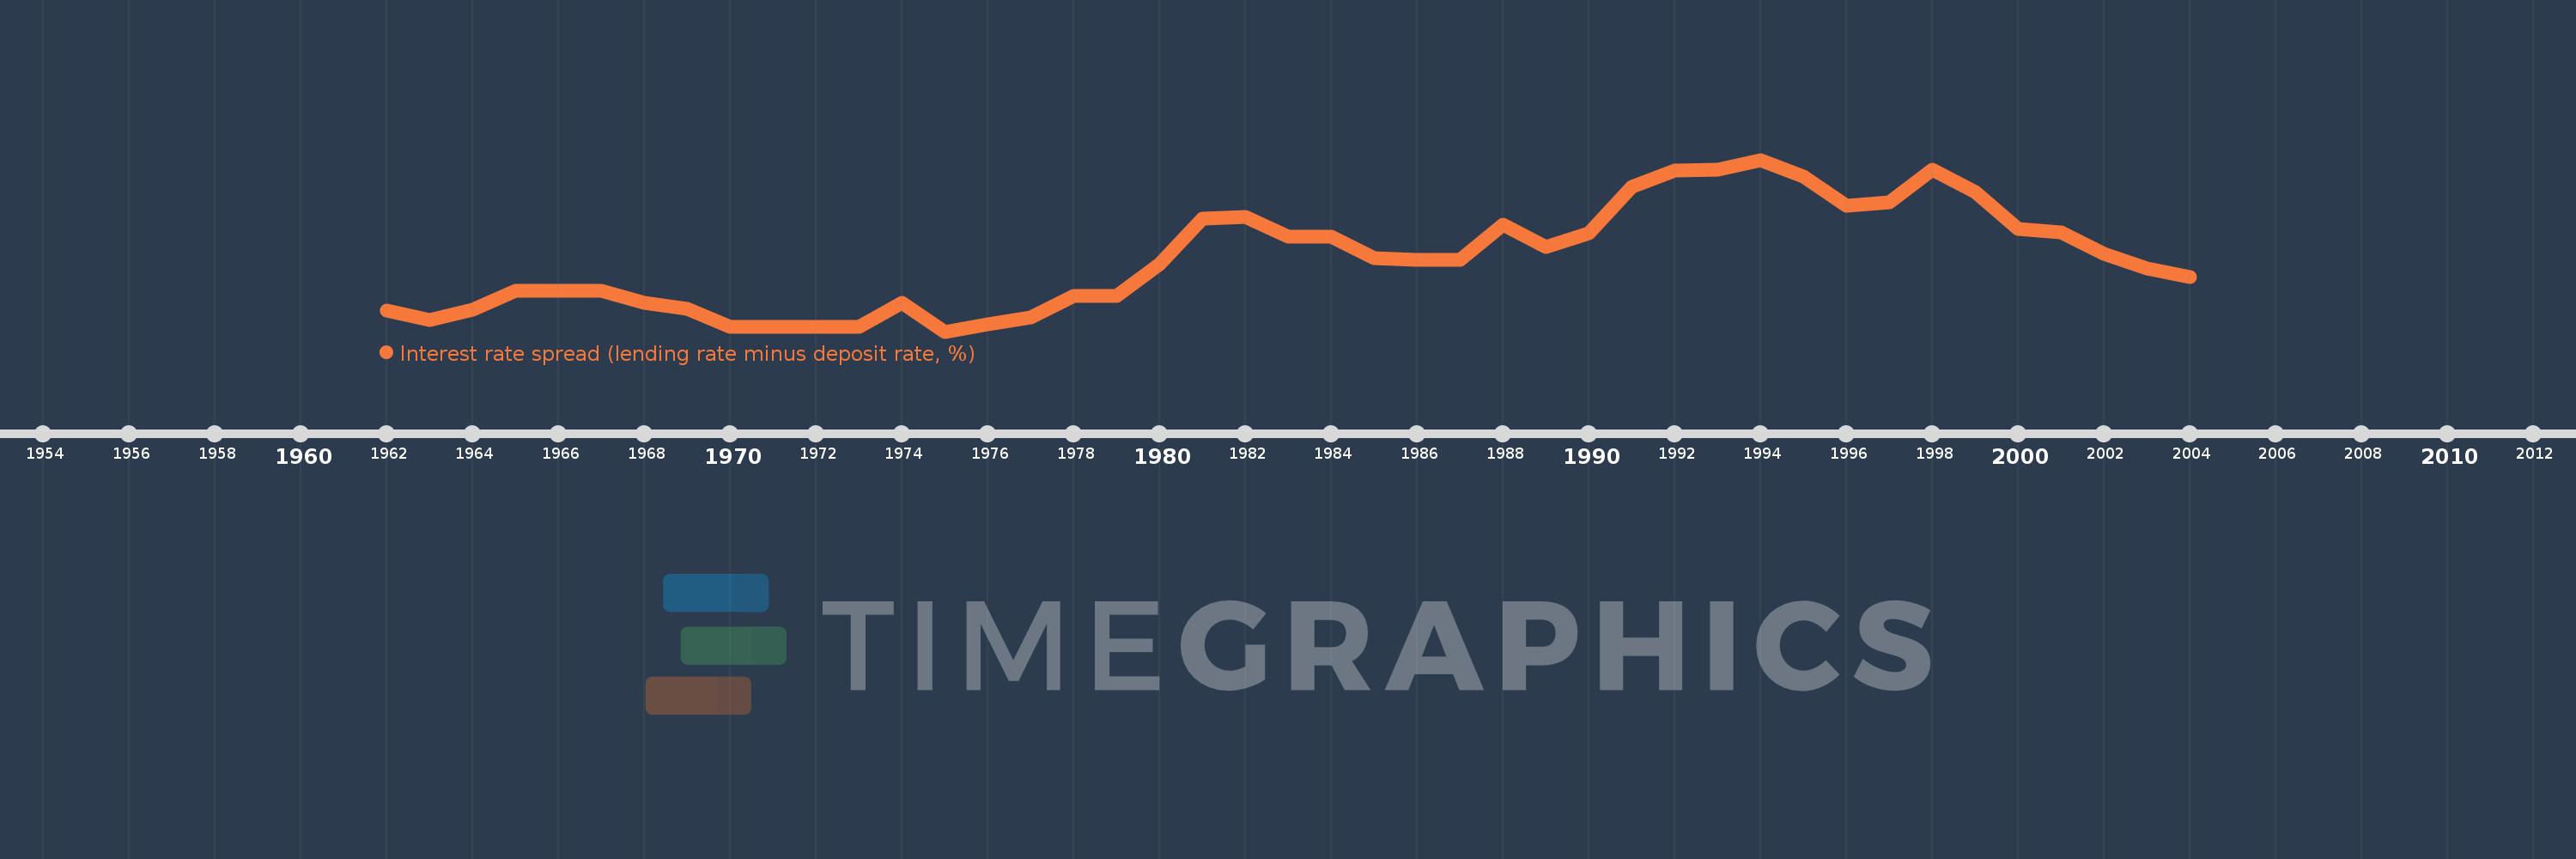
Interest rate spread (lending rate minus deposit rate, %)
2004,2003,2002,2001,2000,1999,1998,1997,1996,1995,1994,1993,1992,1991,1990,1989,1988,1987,1986,1985,1984,1983,1982,1981,1980,1979,1978,1977,1976,1975,1974,1973,1972,1971,1970,1969,1968,1967,1966,1965,1964,1963,1962
Estas estatísticas em outros países:
AlbaniaAlgeriaAngolaAntigua and BarbudaArab WorldArgentinaArmeniaArubaAustraliaAustriaAzerbaijanBahamas, TheBahrainBangladeshBarbadosBelarusBelgiumBelizeBeninBhutanBoliviaBosnia and HerzegovinaBotswanaBrazilBrunei DarussalamBulgariaBurkina FasoBurundiCabo VerdeCameroonCanadaCaribbean small statesCentral African RepublicCentral Europe and the BalticsChadChileChinaColombiaComorosCongo, Dem. Rep.Congo, Rep.Costa RicaCote d'IvoireCroatiaCyprusCzech RepublicDenmarkDjiboutiDominicaDominican RepublicEarly-demographic dividendEast Asia & PacificEast Asia & Pacific (excluding high income)East Asia & Pacific (IDA & IBRD countries)EcuadorEgypt, Arab Rep.Equatorial GuineaEstoniaEthiopiaEuro areaEurope & Central AsiaEurope & Central Asia (excluding high income)Europe & Central Asia (IDA & IBRD countries)European UnionFijiFinlandFragile and conflict affected situationsFranceGabonGambia, TheGeorgiaGermanyGhanaGreeceGrenadaGuatemalaGuineaGuinea-BissauGuyanaHaitiHeavily indebted poor countries (HIPC)High incomeHondurasHong Kong SAR, ChinaHungaryIBRD onlyIcelandIDA & IBRD totalIDA blendIDA onlyIDA totalIndonesiaIran, Islamic Rep.IraqIrelandIsraelItalyJamaicaJapanJordanKenyaKorea, Rep.KosovoKuwaitKyrgyz RepublicLao PDRLate-demographic dividendLatin America & Caribbean Latin America & Caribbean (excluding high income)Latin America & the Caribbean (IDA & IBRD countries)LatviaLeast developed countries: UN classificationLebanonLesothoLiberiaLibyaLithuaniaLow & middle incomeLow incomeLower middle incomeLuxembourgMacao SAR, ChinaMacedonia, FYRMadagascarMalawiMalaysiaMaldivesMaliMaltaMauritaniaMauritiusMexicoMicronesia, Fed. Sts.Middle East & North AfricaMiddle East & North Africa (excluding high income)Middle East & North Africa (IDA & IBRD countries)Middle incomeMoldovaMongoliaMontenegroMoroccoMozambiqueMyanmarNamibiaNepalNetherlandsNew ZealandNicaraguaNigerNigeriaNorwayOECD membersOmanOther small statesPacific island small statesPanamaPapua New GuineaParaguayPeruPhilippinesPolandPortugalPost-demographic dividendPre-demographic dividendQatarRomaniaRussian FederationRwandaSamoaSan MarinoSao Tome and PrincipeSenegalSerbiaSeychellesSierra LeoneSingaporeSlovak RepublicSloveniaSmall statesSolomon IslandsSouth AfricaSouth AsiaSouth Asia (IDA & IBRD)South SudanSpainSri LankaSt. Kitts and NevisSt. LuciaSt. Vincent and the GrenadinesSub-Saharan Africa Sub-Saharan Africa (excluding high income)Sub-Saharan Africa (IDA & IBRD countries)SurinameSwazilandSwedenSwitzerlandSyrian Arab RepublicTajikistanTanzaniaThailandTimor-LesteTogoTongaTrinidad and TobagoTunisiaUgandaUkraineUnited KingdomUpper middle incomeUruguayVanuatuVenezuela, RBVietnamWest Bank and GazaWorldYemen, Rep.ZambiaZimbabwe Linha do tempo:
Nesta escala de tempo está apresentado um gráfico de 1962 ano até 2004 ano Greece. Dados de 1961 ano ausente. O número de observações reais por data: 43.
Fonte (nome):
Indicadores de desenvolvimento mundial
Fonte (organização):
International Monetary Fund, International Financial Statistics and data files.
Categorias:
Financial Sector
Foi atualizado:
23 abr 2017 ano
Indicadores de alterações dos valores ao longo dos anos
Máximo:
9.226
1 jan 1994 ano
Na data de observação
Valor
Mudança absoluta
A alteração em relação ao valor anterior
1 jan 1962 ano
2.875
+2.875
0.0%
1 jan 1963 ano
2.5
-0.375
-13.04%
1 jan 1964 ano
2.933
+0.433
17.33%
1 jan 1965 ano
3.7
+0.767
26.14%
1 jan 1966 ano
3.7
0.0
0.0%
1 jan 1967 ano
3.7
0.0
0.0%
1 jan 1968 ano
3.2
-0.5
-13.51%
1 jan 1969 ano
2.95
-0.25
-7.81%
1 jan 1970 ano
2.2
-0.75
-25.42%
1 jan 1971 ano
2.2
0.0
0.0%
1 jan 1972 ano
2.2
0.0
0.0%
1 jan 1973 ano
2.2
+0.0
0.0%
1 jan 1974 ano
3.2
+1.0
45.45%
1 jan 1975 ano
2.0
-1.2
-37.5%
1 jan 1976 ano
2.292
+0.292
14.58%
1 jan 1977 ano
2.583
+0.292
12.73%
1 jan 1978 ano
3.5
+0.917
35.48%
1 jan 1979 ano
3.5
0.0
0.0%
1 jan 1980 ano
4.833
+1.333
38.1%
1 jan 1981 ano
6.75
+1.917
39.66%
1 jan 1982 ano
6.833
+0.083
1.23%
1 jan 1983 ano
6.0
-0.833
-12.2%
1 jan 1984 ano
6.0
0.0
0.0%
1 jan 1985 ano
5.083
-0.917
-15.28%
1 jan 1986 ano
5.0
-0.083
-1.64%
1 jan 1987 ano
5.0
0.0
0.0%
1 jan 1988 ano
6.487
+1.487
29.75%
1 jan 1989 ano
5.567
-0.921
-14.19%
1 jan 1990 ano
6.122
+0.556
9.99%
1 jan 1991 ano
8.101
+1.978
32.31%
1 jan 1992 ano
8.783
+0.682
8.43%
1 jan 1993 ano
8.793
+0.01
0.11%
1 jan 1994 ano
9.226
+0.433
4.92%
1 jan 1995 ano
8.525
-0.701
-7.6%
1 jan 1996 ano
7.3
-1.225
-14.37%
1 jan 1997 ano
7.45
+0.15
2.05%
1 jan 1998 ano
8.808
+1.358
18.23%
1 jan 1999 ano
7.858
-0.95
-10.79%
1 jan 2000 ano
6.308
-1.55
-19.72%
1 jan 2001 ano
6.183
-0.125
-1.98%
1 jan 2002 ano
5.268
-0.915
-14.8%
1 jan 2003 ano
4.655
-0.613
-11.64%
1 jan 2004 ano
4.308
-0.348
-7.47%
Classificação de países por estatísticas atuais por anos


Comentários: