29
/pt/
pt
AIzaSyAYiBZKx7MnpbEhh9jyipgxe19OcubqV5w
April 1, 2024
239442
Sierra Leone
SLE
true
2
1
Inflation, consumer prices (annual %)
2016,2015,2014,2013,2012,2011,2010,2009,2008,2007,2006,2005,2004,2003,2002,2001,2000,1999,1998,1997,1996,1995,1994,1993,1992,1991,1990,1989,1988,1987,1986,1985,1984,1983,1982,1981,1980,1979,1978,1977,1976,1975,1974,1973,1972,1971,1970,1969,1968,1967,1966,1965,1964,1963,1962,1961
Estas estatísticas em outros países:
AfghanistanAlbaniaAlgeriaAngolaAntigua and BarbudaArab WorldArgentinaArmeniaArubaAustraliaAustriaAzerbaijanBahamas, TheBahrainBangladeshBarbadosBelarusBelgiumBelizeBeninBhutanBoliviaBotswanaBrazilBrunei DarussalamBulgariaBurkina FasoBurundiCabo VerdeCambodiaCameroonCanadaCaribbean small statesCentral African RepublicCentral Europe and the BalticsChadChileChinaColombiaComorosCongo, Dem. Rep.Congo, Rep.Costa RicaCote d'IvoireCroatiaCyprusCzech RepublicDenmarkDjiboutiDominicaDominican RepublicEarly-demographic dividendEast Asia & PacificEast Asia & Pacific (excluding high income)East Asia & Pacific (IDA & IBRD countries)EcuadorEgypt, Arab Rep.El SalvadorEquatorial GuineaEstoniaEthiopiaEuro areaEurope & Central AsiaEurope & Central Asia (excluding high income)Europe & Central Asia (IDA & IBRD countries)European UnionFijiFinlandFragile and conflict affected situationsFranceGabonGambia, TheGeorgiaGermanyGhanaGreeceGrenadaGuatemalaGuineaGuinea-BissauGuyanaHaitiHeavily indebted poor countries (HIPC)High incomeHondurasHong Kong SAR, ChinaHungaryIBRD onlyIcelandIDA & IBRD totalIDA blendIDA onlyIDA totalIndiaIndonesiaIran, Islamic Rep.IraqIrelandIsraelItalyJamaicaJapanJordanKazakhstanKenyaKorea, Rep.KuwaitKyrgyz RepublicLao PDRLate-demographic dividendLatin America & Caribbean Latin America & Caribbean (excluding high income)Latin America & the Caribbean (IDA & IBRD countries)LatviaLeast developed countries: UN classificationLebanonLesothoLiberiaLibyaLithuaniaLow & middle incomeLow incomeLower middle incomeLuxembourgMacao SAR, ChinaMacedonia, FYRMadagascarMalawiMalaysiaMaldivesMaliMaltaMauritaniaMauritiusMexicoMiddle East & North AfricaMiddle East & North Africa (excluding high income)Middle East & North Africa (IDA & IBRD countries)Middle incomeMoldovaMongoliaMontenegroMoroccoMozambiqueMyanmarNamibiaNepalNetherlandsNew ZealandNicaraguaNigerNigeriaNorth AmericaNorwayOECD membersOmanOther small statesPakistanPanamaPapua New GuineaParaguayPeruPhilippinesPolandPortugalPost-demographic dividendPre-demographic dividendQatarRomaniaRussian FederationRwandaSamoaSao Tome and PrincipeSaudi ArabiaSenegalSerbiaSeychellesSierra LeoneSingaporeSlovak RepublicSloveniaSmall statesSolomon IslandsSouth AfricaSouth AsiaSouth Asia (IDA & IBRD)South SudanSpainSri LankaSt. Kitts and NevisSt. LuciaSt. Vincent and the GrenadinesSub-Saharan Africa Sub-Saharan Africa (excluding high income)Sub-Saharan Africa (IDA & IBRD countries)SudanSurinameSwazilandSwedenSwitzerlandSyrian Arab RepublicTajikistanTanzaniaThailandTimor-LesteTogoTongaTrinidad and TobagoTunisiaTurkeyUgandaUkraineUnited KingdomUnited StatesUpper middle incomeUruguayVanuatuVenezuela, RBVietnamWorldYemen, Rep.ZambiaZimbabwe Linha do tempo:
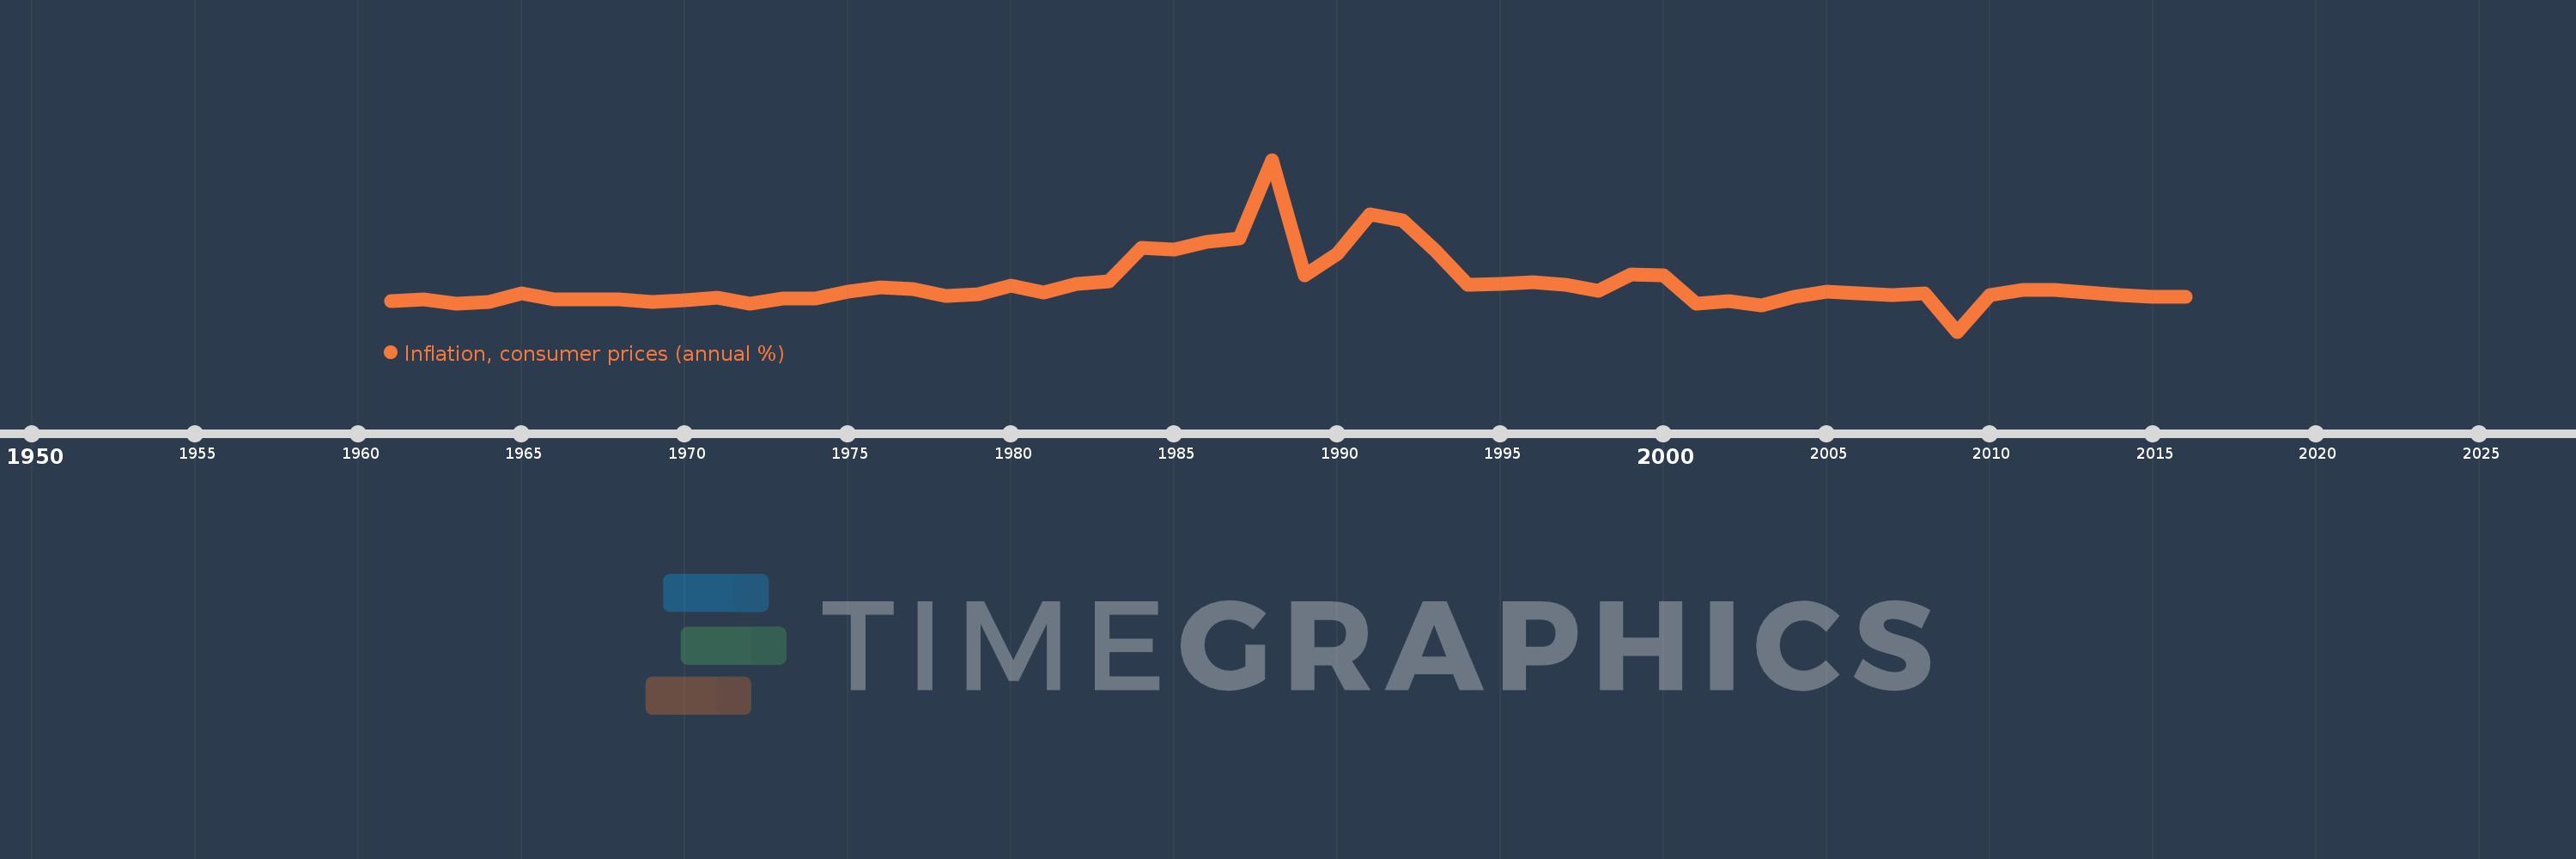
Nesta escala de tempo está apresentado um gráfico de 1961 ano até 2016 ano Sierra Leone. Dados de 1960 ano ausente. O número de observações reais por data: 56.
Fonte (nome):
Indicadores de desenvolvimento mundial
Fonte (organização):
International Monetary Fund, International Financial Statistics and data files.
Categorias:
Economy & Growth, Financial Sector
Foi atualizado:
23 abr 2017 ano
Indicadores de alterações dos valores ao longo dos anos
Mínimo:
-35.837
1 jan 2009 ano
Máximo:
178.7
1 jan 1988 ano
Na data de observação
Valor
Mudança absoluta
A alteração em relação ao valor anterior
1 jan 1961 ano
2.345
+2.345
0.0%
1 jan 1962 ano
4.141
+1.795
76.54%
1 jan 1963 ano
-0.85
-4.991
-120.53%
1 jan 1964 ano
0.731
+1.582
-186.03%
1 jan 1965 ano
11.542
+10.811
1.48 mil%
1 jan 1966 ano
4.669
-6.873
-59.55%
1 jan 1967 ano
4.311
-0.358
-7.68%
1 jan 1968 ano
4.852
+0.541
12.56%
1 jan 1969 ano
1.611
-3.241
-66.79%
1 jan 1970 ano
3.064
+1.453
90.18%
1 jan 1971 ano
6.403
+3.339
108.98%
1 jan 1972 ano
-1.27
-7.673
-119.83%
1 jan 1973 ano
5.502
+6.772
-533.19%
1 jan 1974 ano
5.665
+0.163
2.97%
1 jan 1975 ano
14.415
+8.75
154.46%
1 jan 1976 ano
19.907
+5.492
38.1%
1 jan 1977 ano
17.184
-2.723
-13.68%
1 jan 1978 ano
8.337
-8.847
-51.48%
1 jan 1979 ano
10.896
+2.559
30.69%
1 jan 1980 ano
21.25
+10.354
95.03%
1 jan 1981 ano
12.912
-8.338
-39.24%
1 jan 1982 ano
23.369
+10.458
80.99%
1 jan 1983 ano
26.89
+3.52
15.06%
1 jan 1984 ano
68.526
+41.636
154.84%
1 jan 1985 ano
66.575
-1.951
-2.85%
1 jan 1986 ano
76.576
+10.002
15.02%
1 jan 1987 ano
80.867
+4.291
5.6%
1 jan 1988 ano
178.7
+97.833
120.98%
1 jan 1989 ano
34.287
-144.414
-80.81%
1 jan 1990 ano
60.8
+26.514
77.33%
1 jan 1991 ano
110.946
+50.145
82.48%
1 jan 1992 ano
102.695
-8.251
-7.44%
1 jan 1993 ano
65.5
-37.194
-36.22%
1 jan 1994 ano
22.209
-43.291
-66.09%
1 jan 1995 ano
24.204
+1.995
8.98%
1 jan 1996 ano
25.981
+1.777
7.34%
1 jan 1997 ano
23.137
-2.844
-10.95%
1 jan 1998 ano
14.95
-8.187
-35.39%
1 jan 1999 ano
35.533
+20.583
137.68%
1 jan 2000 ano
34.084
-1.449
-4.08%
1 jan 2001 ano
-0.836
-34.92
-102.45%
1 jan 2002 ano
2.09
+2.927
-349.9%
1 jan 2003 ano
-3.286
-5.376
-257.2%
1 jan 2004 ano
7.6
+10.885
-331.27%
1 jan 2005 ano
14.188
+6.589
86.7%
1 jan 2006 ano
12.051
-2.138
-15.07%
1 jan 2007 ano
9.539
-2.511
-20.84%
1 jan 2008 ano
11.656
+2.117
22.19%
1 jan 2009 ano
-35.837
-47.493
-407.45%
1 jan 2010 ano
9.252
+45.089
-125.82%
1 jan 2011 ano
16.635
+7.383
79.8%
1 jan 2012 ano
16.192
-0.443
-2.67%
1 jan 2013 ano
12.87
-3.322
-20.51%
1 jan 2014 ano
10.266
-2.604
-20.23%
1 jan 2015 ano
7.329
-2.937
-28.61%
1 jan 2016 ano
7.982
+0.653
8.91%
Classificação de países por estatísticas atuais por anos


Comentários: