29
/pt/
pt
AIzaSyAYiBZKx7MnpbEhh9jyipgxe19OcubqV5w
April 1, 2024
216582
Pakistan
PAK
true
2
1
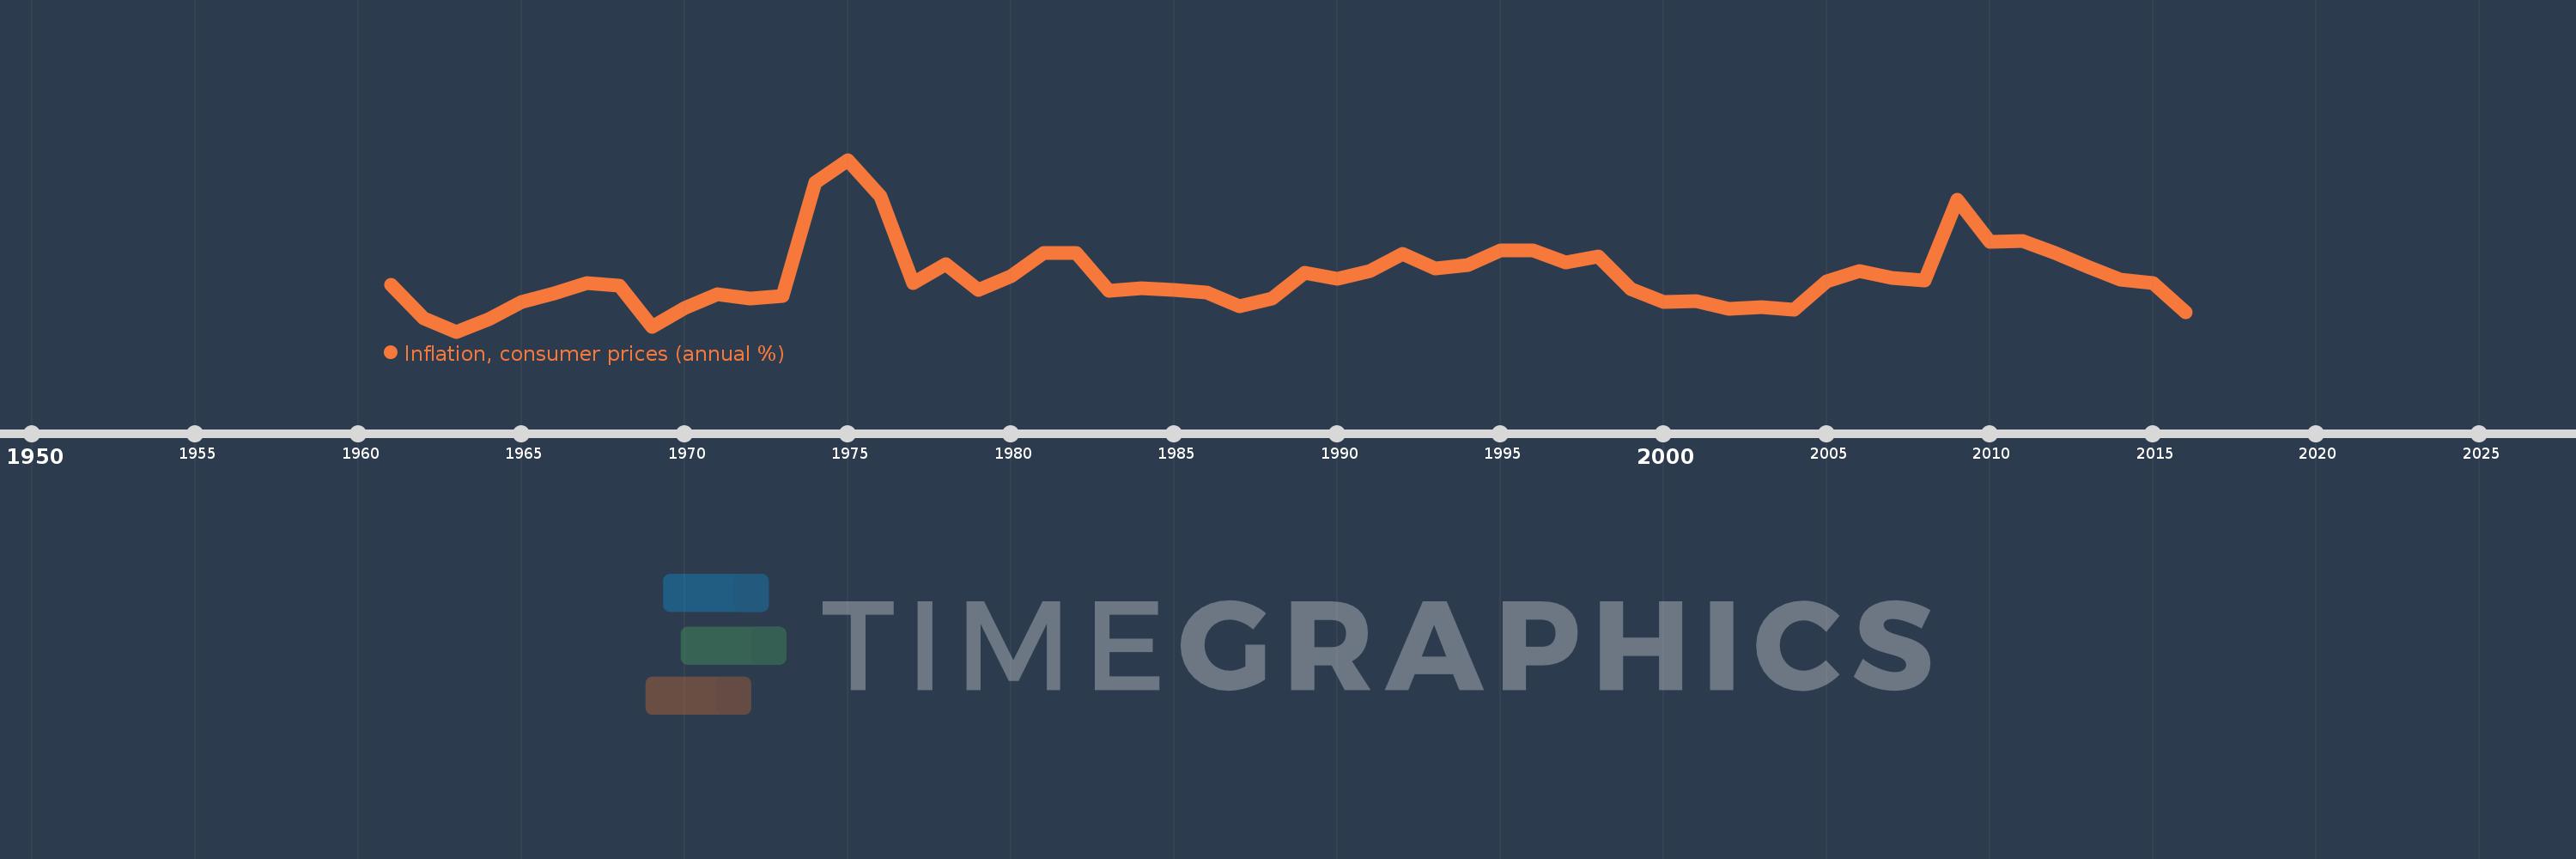
Inflation, consumer prices (annual %)
2016,2015,2014,2013,2012,2011,2010,2009,2008,2007,2006,2005,2004,2003,2002,2001,2000,1999,1998,1997,1996,1995,1994,1993,1992,1991,1990,1989,1988,1987,1986,1985,1984,1983,1982,1981,1980,1979,1978,1977,1976,1975,1974,1973,1972,1971,1970,1969,1968,1967,1966,1965,1964,1963,1962,1961
Estas estatísticas em outros países:
AfghanistanAlbaniaAlgeriaAngolaAntigua and BarbudaArab WorldArgentinaArmeniaArubaAustraliaAustriaAzerbaijanBahamas, TheBahrainBangladeshBarbadosBelarusBelgiumBelizeBeninBhutanBoliviaBotswanaBrazilBrunei DarussalamBulgariaBurkina FasoBurundiCabo VerdeCambodiaCameroonCanadaCaribbean small statesCentral African RepublicCentral Europe and the BalticsChadChileChinaColombiaComorosCongo, Dem. Rep.Congo, Rep.Costa RicaCote d'IvoireCroatiaCyprusCzech RepublicDenmarkDjiboutiDominicaDominican RepublicEarly-demographic dividendEast Asia & PacificEast Asia & Pacific (excluding high income)East Asia & Pacific (IDA & IBRD countries)EcuadorEgypt, Arab Rep.El SalvadorEquatorial GuineaEstoniaEthiopiaEuro areaEurope & Central AsiaEurope & Central Asia (excluding high income)Europe & Central Asia (IDA & IBRD countries)European UnionFijiFinlandFragile and conflict affected situationsFranceGabonGambia, TheGeorgiaGermanyGhanaGreeceGrenadaGuatemalaGuineaGuinea-BissauGuyanaHaitiHeavily indebted poor countries (HIPC)High incomeHondurasHong Kong SAR, ChinaHungaryIBRD onlyIcelandIDA & IBRD totalIDA blendIDA onlyIDA totalIndiaIndonesiaIran, Islamic Rep.IraqIrelandIsraelItalyJamaicaJapanJordanKazakhstanKenyaKorea, Rep.KuwaitKyrgyz RepublicLao PDRLate-demographic dividendLatin America & Caribbean Latin America & Caribbean (excluding high income)Latin America & the Caribbean (IDA & IBRD countries)LatviaLeast developed countries: UN classificationLebanonLesothoLiberiaLibyaLithuaniaLow & middle incomeLow incomeLower middle incomeLuxembourgMacao SAR, ChinaMacedonia, FYRMadagascarMalawiMalaysiaMaldivesMaliMaltaMauritaniaMauritiusMexicoMiddle East & North AfricaMiddle East & North Africa (excluding high income)Middle East & North Africa (IDA & IBRD countries)Middle incomeMoldovaMongoliaMontenegroMoroccoMozambiqueMyanmarNamibiaNepalNetherlandsNew ZealandNicaraguaNigerNigeriaNorth AmericaNorwayOECD membersOmanOther small statesPakistanPanamaPapua New GuineaParaguayPeruPhilippinesPolandPortugalPost-demographic dividendPre-demographic dividendQatarRomaniaRussian FederationRwandaSamoaSao Tome and PrincipeSaudi ArabiaSenegalSerbiaSeychellesSierra LeoneSingaporeSlovak RepublicSloveniaSmall statesSolomon IslandsSouth AfricaSouth AsiaSouth Asia (IDA & IBRD)South SudanSpainSri LankaSt. Kitts and NevisSt. LuciaSt. Vincent and the GrenadinesSub-Saharan Africa Sub-Saharan Africa (excluding high income)Sub-Saharan Africa (IDA & IBRD countries)SudanSurinameSwazilandSwedenSwitzerlandSyrian Arab RepublicTajikistanTanzaniaThailandTimor-LesteTogoTongaTrinidad and TobagoTunisiaTurkeyUgandaUkraineUnited KingdomUnited StatesUpper middle incomeUruguayVanuatuVenezuela, RBVietnamWorldYemen, Rep.ZambiaZimbabwe Linha do tempo:
Nesta escala de tempo está apresentado um gráfico de 1961 ano até 2016 ano Pakistan. Dados de 1960 ano ausente. O número de observações reais por data: 56.
Fonte (nome):
Indicadores de desenvolvimento mundial
Fonte (organização):
International Monetary Fund, International Financial Statistics and data files.
Categorias:
Economy & Growth, Financial Sector
Foi atualizado:
23 abr 2017 ano
Indicadores de alterações dos valores ao longo dos anos
Mínimo:
-0.516
1 jan 1963 ano
Máximo:
26.663
1 jan 1975 ano
Na data de observação
Valor
Mudança absoluta
A alteração em relação ao valor anterior
1 jan 1961 ano
6.947
+6.947
0.0%
1 jan 1962 ano
1.64
-5.307
-76.39%
1 jan 1963 ano
-0.516
-2.157
-131.48%
1 jan 1964 ano
1.456
+1.973
-382.01%
1 jan 1965 ano
4.18
+2.723
186.96%
1 jan 1966 ano
5.569
+1.389
33.23%
1 jan 1967 ano
7.228
+1.659
29.79%
1 jan 1968 ano
6.811
-0.416
-5.76%
1 jan 1969 ano
0.171
-6.641
-97.49%
1 jan 1970 ano
3.187
+3.016
1.77 mil%
1 jan 1971 ano
5.35
+2.163
67.87%
1 jan 1972 ano
4.731
-0.619
-11.57%
1 jan 1973 ano
5.183
+0.453
9.57%
1 jan 1974 ano
23.07
+17.887
345.09%
1 jan 1975 ano
26.663
+3.593
15.57%
1 jan 1976 ano
20.905
-5.759
-21.6%
1 jan 1977 ano
7.158
-13.746
-65.76%
1 jan 1978 ano
10.133
+2.975
41.56%
1 jan 1979 ano
6.139
-3.994
-39.42%
1 jan 1980 ano
8.267
+2.128
34.67%
1 jan 1981 ano
11.938
+3.671
44.41%
1 jan 1982 ano
11.88
-0.058
-0.49%
1 jan 1983 ano
5.904
-5.976
-50.31%
1 jan 1984 ano
6.362
+0.459
7.77%
1 jan 1985 ano
6.087
-0.275
-4.32%
1 jan 1986 ano
5.615
-0.472
-7.76%
1 jan 1987 ano
3.506
-2.108
-37.55%
1 jan 1988 ano
4.681
+1.175
33.5%
1 jan 1989 ano
8.838
+4.157
88.8%
1 jan 1990 ano
7.844
-0.994
-11.24%
1 jan 1991 ano
9.052
+1.208
15.4%
1 jan 1992 ano
11.791
+2.739
30.26%
1 jan 1993 ano
9.509
-2.282
-19.36%
1 jan 1994 ano
9.974
+0.465
4.89%
1 jan 1995 ano
12.368
+2.395
24.01%
1 jan 1996 ano
12.344
-0.025
-0.2%
1 jan 1997 ano
10.374
-1.97
-15.96%
1 jan 1998 ano
11.375
+1.002
9.66%
1 jan 1999 ano
6.228
-5.147
-45.25%
1 jan 2000 ano
4.143
-2.085
-33.48%
1 jan 2001 ano
4.367
+0.224
5.41%
1 jan 2002 ano
3.148
-1.218
-27.9%
1 jan 2003 ano
3.29
+0.142
4.51%
1 jan 2004 ano
2.914
-0.376
-11.43%
1 jan 2005 ano
7.445
+4.53
155.47%
1 jan 2006 ano
9.063
+1.619
21.74%
1 jan 2007 ano
7.921
-1.142
-12.6%
1 jan 2008 ano
7.599
-0.322
-4.07%
1 jan 2009 ano
20.286
+12.687
166.97%
1 jan 2010 ano
13.648
-6.638
-32.72%
1 jan 2011 ano
13.881
+0.233
1.71%
1 jan 2012 ano
11.917
-1.964
-14.15%
1 jan 2013 ano
9.685
-2.232
-18.73%
1 jan 2014 ano
7.69
-1.996
-20.6%
1 jan 2015 ano
7.192
-0.498
-6.47%
1 jan 2016 ano
2.54
-4.652
-64.69%
Classificação de países por estatísticas atuais por anos


Comentários: