29
/pt/
pt
AIzaSyAYiBZKx7MnpbEhh9jyipgxe19OcubqV5w
April 1, 2024
230469
Russian Federation
RUS
true
2
1
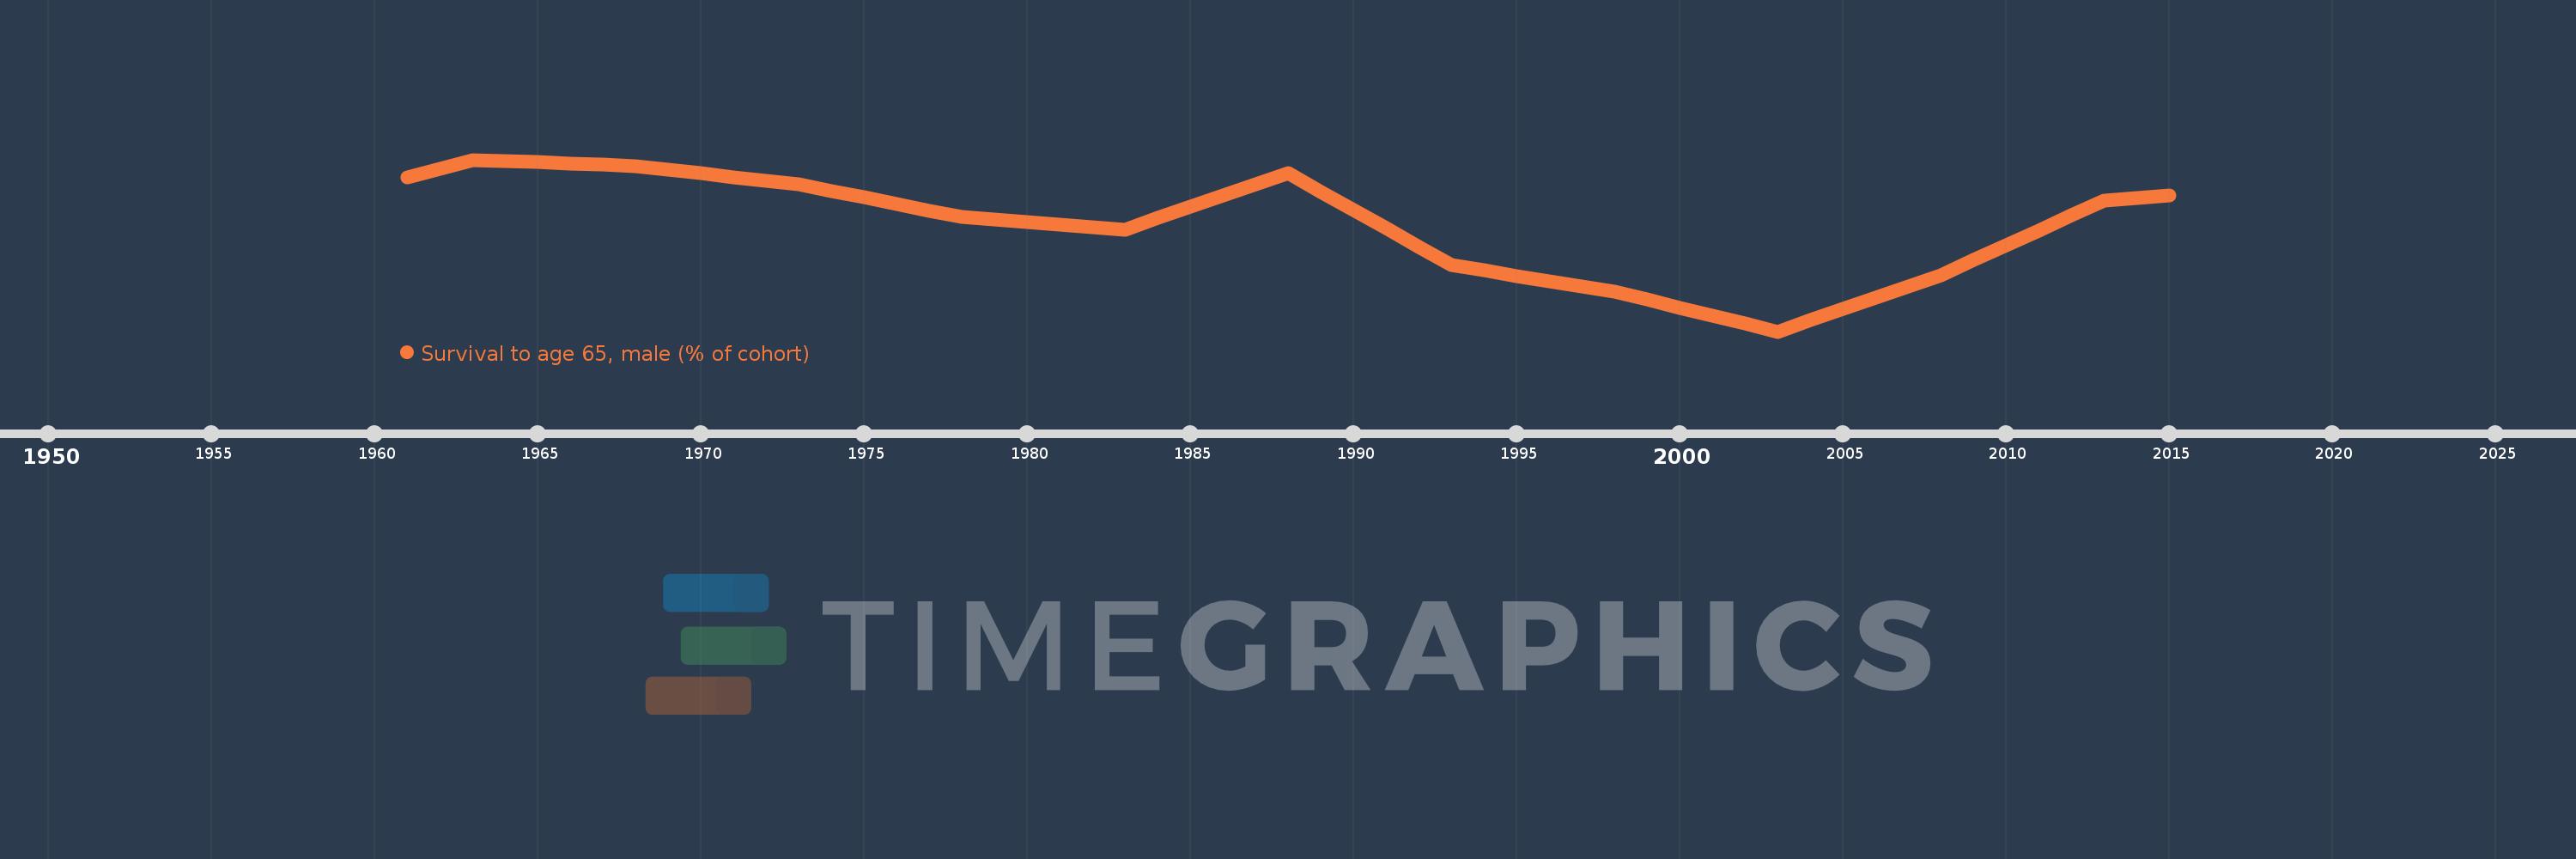
Survival to age 65, male (% of cohort)
2015,2014,2013,2012,2011,2010,2009,2008,2007,2006,2005,2004,2003,2002,2001,2000,1999,1998,1997,1996,1995,1994,1993,1992,1991,1990,1989,1988,1987,1986,1985,1984,1983,1982,1981,1980,1979,1978,1977,1976,1975,1974,1973,1972,1971,1970,1969,1968,1967,1966,1965,1964,1963,1962,1961
Estas estatísticas em outros países:
AfghanistanAlbaniaAlgeriaAngolaAntigua and BarbudaArab WorldArgentinaArmeniaArubaAustraliaAustriaAzerbaijanBahamas, TheBahrainBangladeshBarbadosBelarusBelgiumBelizeBeninBhutanBoliviaBosnia and HerzegovinaBotswanaBrazilBrunei DarussalamBulgariaBurkina FasoBurundiCabo VerdeCambodiaCameroonCanadaCaribbean small statesCentral African RepublicCentral Europe and the BalticsChadChannel IslandsChileChinaColombiaComorosCongo, Dem. Rep.Congo, Rep.Costa RicaCote d'IvoireCroatiaCubaCuracaoCyprusCzech RepublicDenmarkDjiboutiDominican RepublicEarly-demographic dividendEast Asia & PacificEast Asia & Pacific (excluding high income)East Asia & Pacific (IDA & IBRD countries)EcuadorEgypt, Arab Rep.El SalvadorEquatorial GuineaEritreaEstoniaEthiopiaEuro areaEurope & Central AsiaEurope & Central Asia (excluding high income)Europe & Central Asia (IDA & IBRD countries)European UnionFijiFinlandFragile and conflict affected situationsFranceFrench PolynesiaGabonGambia, TheGeorgiaGermanyGhanaGreeceGrenadaGuamGuatemalaGuineaGuinea-BissauGuyanaHaitiHeavily indebted poor countries (HIPC)High incomeHondurasHong Kong SAR, ChinaHungaryIBRD onlyIcelandIDA & IBRD totalIDA blendIDA onlyIDA totalIndiaIndonesiaIran, Islamic Rep.IraqIrelandIsraelItalyJamaicaJapanJordanKazakhstanKenyaKiribatiKorea, Dem. People’s Rep.Korea, Rep.KuwaitKyrgyz RepublicLao PDRLate-demographic dividendLatin America & Caribbean Latin America & Caribbean (excluding high income)Latin America & the Caribbean (IDA & IBRD countries)LatviaLeast developed countries: UN classificationLebanonLesothoLiberiaLibyaLithuaniaLow & middle incomeLow incomeLower middle incomeLuxembourgMacao SAR, ChinaMacedonia, FYRMadagascarMalawiMalaysiaMaldivesMaliMaltaMauritaniaMauritiusMexicoMicronesia, Fed. Sts.Middle East & North AfricaMiddle East & North Africa (excluding high income)Middle East & North Africa (IDA & IBRD countries)Middle incomeMoldovaMongoliaMontenegroMoroccoMozambiqueMyanmarNamibiaNepalNetherlandsNew CaledoniaNew ZealandNicaraguaNigerNigeriaNorth AmericaNorwayOECD membersOmanOther small statesPacific island small statesPakistanPanamaPapua New GuineaParaguayPeruPhilippinesPolandPortugalPost-demographic dividendPre-demographic dividendPuerto RicoQatarRomaniaRussian FederationRwandaSamoaSao Tome and PrincipeSaudi ArabiaSenegalSerbiaSeychellesSierra LeoneSingaporeSlovak RepublicSloveniaSmall statesSolomon IslandsSomaliaSouth AfricaSouth AsiaSouth Asia (IDA & IBRD)South SudanSpainSri LankaSt. LuciaSt. Vincent and the GrenadinesSub-Saharan Africa Sub-Saharan Africa (excluding high income)Sub-Saharan Africa (IDA & IBRD countries)SudanSurinameSwazilandSwedenSwitzerlandSyrian Arab RepublicTajikistanTanzaniaThailandTimor-LesteTogoTongaTrinidad and TobagoTunisiaTurkeyTurkmenistanUgandaUkraineUnited Arab EmiratesUnited KingdomUnited StatesUpper middle incomeUruguayUzbekistanVanuatuVenezuela, RBVietnamVirgin Islands (U.S.)West Bank and GazaWorldYemen, Rep.ZambiaZimbabwe Linha do tempo:
Nesta escala de tempo está apresentado um gráfico de 1961 ano até 2015 ano Russian Federation. Dados de 1960 ano ausente. O número de observações reais por data: 55.
Fonte (nome):
Indicadores de desenvolvimento mundial
Fonte (organização):
United Nations Population Division. World Population Prospects. New York, United Nations, Department of Economic and Social Affairs (advanced Excel tables). Available at http://esa.un.org/wpp/unpp/panel_population.htm.
Categorias:
Health, Gender
Foi atualizado:
23 abr 2017 ano
Indicadores de alterações dos valores ao longo dos anos
Mínimo:
41.574
1 jan 2003 ano
Máximo:
58.521
1 jan 1963 ano
Na data de observação
Valor
Mudança absoluta
A alteração em relação ao valor anterior
1 jan 1961 ano
56.769
+56.769
0.0%
1 jan 1962 ano
57.645
+0.876
1.54%
1 jan 1963 ano
58.521
+0.876
1.52%
1 jan 1964 ano
58.4
-0.122
-0.21%
1 jan 1965 ano
58.278
-0.122
-0.21%
1 jan 1966 ano
58.156
-0.122
-0.21%
1 jan 1967 ano
58.035
-0.122
-0.21%
1 jan 1968 ano
57.913
-0.122
-0.21%
1 jan 1969 ano
57.55
-0.363
-0.63%
1 jan 1970 ano
57.186
-0.363
-0.63%
1 jan 1971 ano
56.823
-0.363
-0.64%
1 jan 1972 ano
56.46
-0.363
-0.64%
1 jan 1973 ano
56.096
-0.363
-0.64%
1 jan 1974 ano
55.446
-0.65
-1.16%
1 jan 1975 ano
54.797
-0.65
-1.17%
1 jan 1976 ano
54.147
-0.65
-1.19%
1 jan 1977 ano
53.497
-0.65
-1.2%
1 jan 1978 ano
52.847
-0.65
-1.21%
1 jan 1979 ano
52.609
-0.238
-0.45%
1 jan 1980 ano
52.371
-0.238
-0.45%
1 jan 1981 ano
52.132
-0.238
-0.46%
1 jan 1982 ano
51.894
-0.238
-0.46%
1 jan 1983 ano
51.656
-0.238
-0.46%
1 jan 1984 ano
52.761
+1.106
2.14%
1 jan 1985 ano
53.867
+1.106
2.1%
1 jan 1986 ano
54.972
+1.106
2.05%
1 jan 1987 ano
56.078
+1.106
2.01%
1 jan 1988 ano
57.184
+1.106
1.97%
1 jan 1989 ano
55.372
-1.812
-3.17%
1 jan 1990 ano
53.56
-1.812
-3.27%
1 jan 1991 ano
51.748
-1.812
-3.38%
1 jan 1992 ano
49.936
-1.812
-3.5%
1 jan 1993 ano
48.124
-1.812
-3.63%
1 jan 1994 ano
47.602
-0.522
-1.08%
1 jan 1995 ano
47.08
-0.522
-1.1%
1 jan 1996 ano
46.558
-0.522
-1.11%
1 jan 1997 ano
46.036
-0.522
-1.12%
1 jan 1998 ano
45.514
-0.522
-1.13%
1 jan 1999 ano
44.726
-0.788
-1.73%
1 jan 2000 ano
43.938
-0.788
-1.76%
1 jan 2001 ano
43.15
-0.788
-1.79%
1 jan 2002 ano
42.362
-0.788
-1.83%
1 jan 2003 ano
41.574
-0.788
-1.86%
1 jan 2004 ano
42.687
+1.112
2.68%
1 jan 2005 ano
43.799
+1.112
2.61%
1 jan 2006 ano
44.911
+1.112
2.54%
1 jan 2007 ano
46.024
+1.112
2.48%
1 jan 2008 ano
47.136
+1.112
2.42%
1 jan 2009 ano
48.614
+1.479
3.14%
1 jan 2010 ano
50.093
+1.479
3.04%
1 jan 2011 ano
51.571
+1.479
2.95%
1 jan 2012 ano
53.05
+1.479
2.87%
1 jan 2013 ano
54.529
+1.479
2.79%
1 jan 2014 ano
54.78
+0.252
0.46%
1 jan 2015 ano
55.032
+0.252
0.46%
Classificação de países por estatísticas atuais por anos


Comentários: