29
/pt/
pt
AIzaSyAYiBZKx7MnpbEhh9jyipgxe19OcubqV5w
April 1, 2024
203651
Mozambique
MOZ
true
2
1
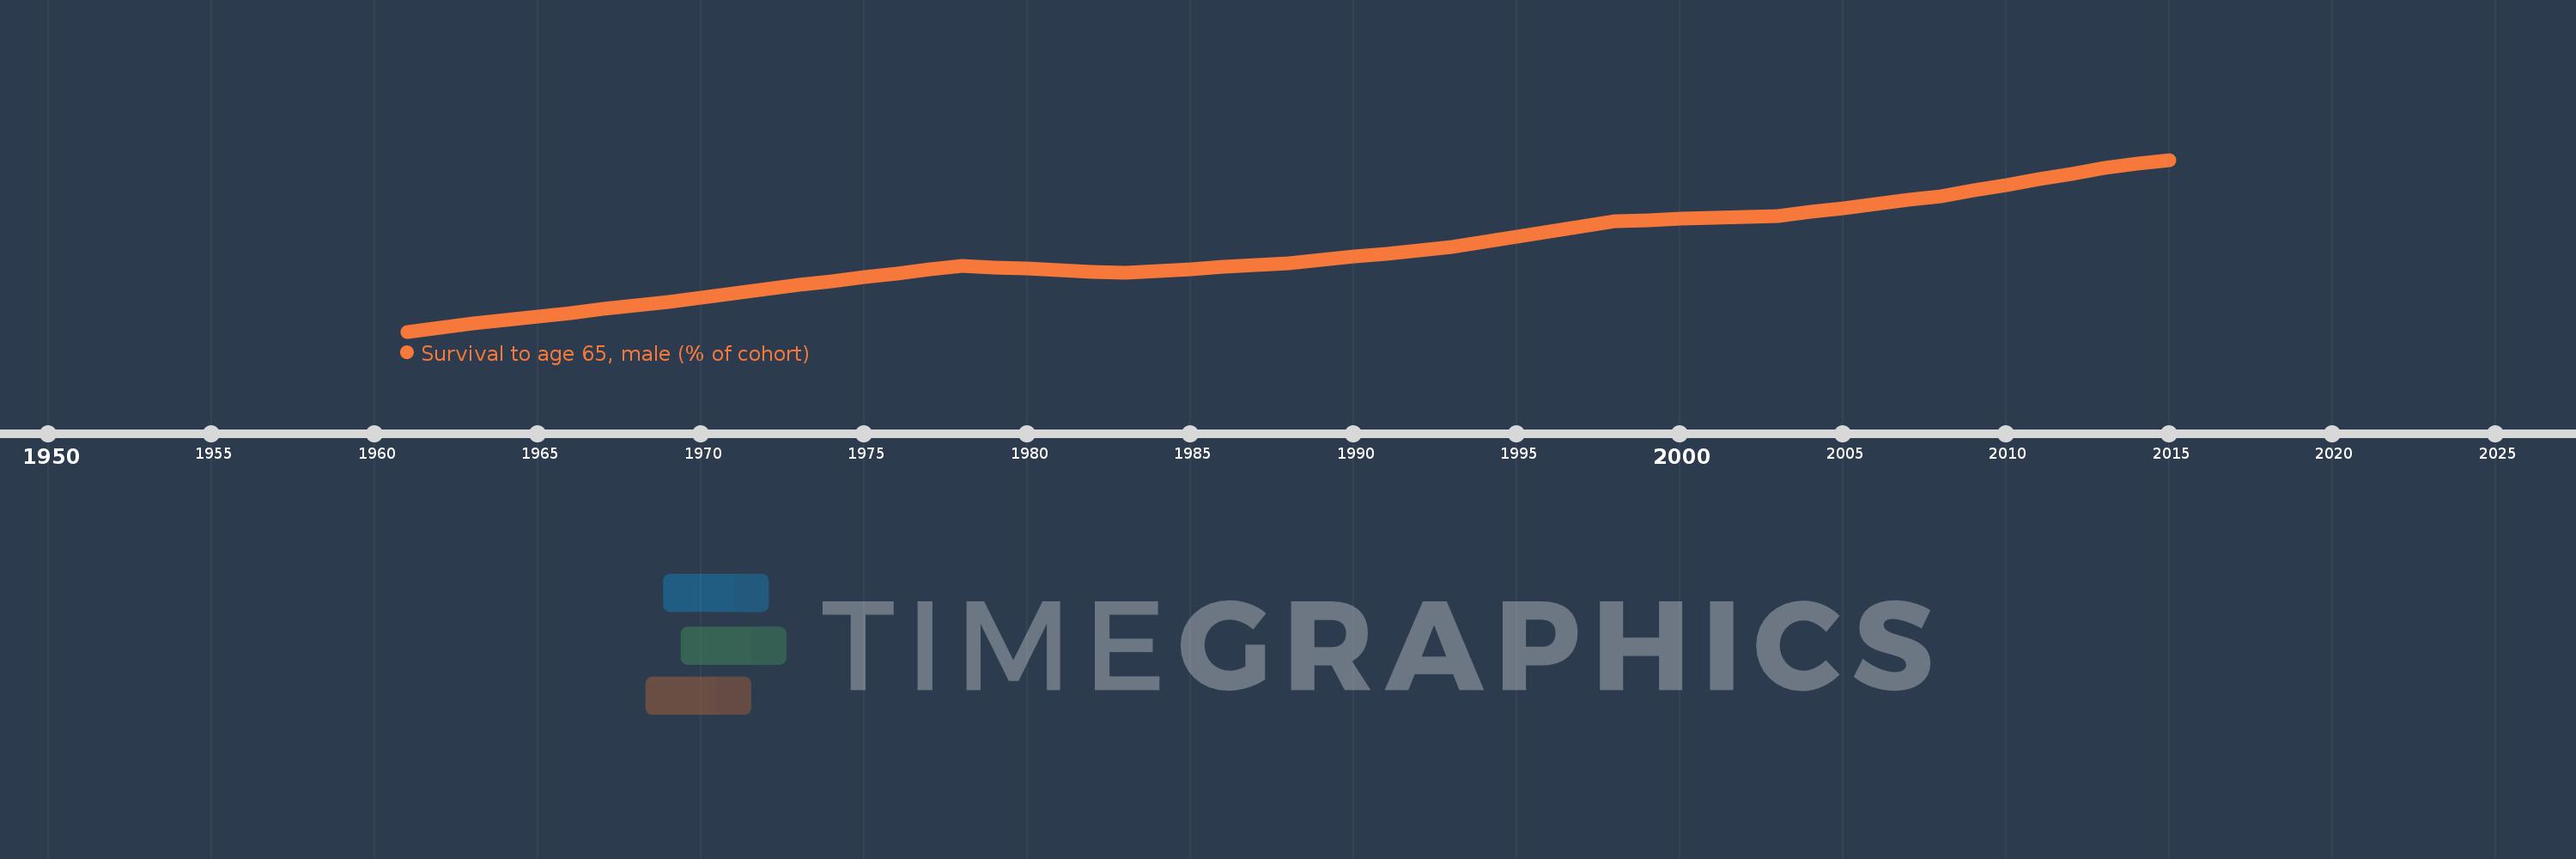
Survival to age 65, male (% of cohort)
2015,2014,2013,2012,2011,2010,2009,2008,2007,2006,2005,2004,2003,2002,2001,2000,1999,1998,1997,1996,1995,1994,1993,1992,1991,1990,1989,1988,1987,1986,1985,1984,1983,1982,1981,1980,1979,1978,1977,1976,1975,1974,1973,1972,1971,1970,1969,1968,1967,1966,1965,1964,1963,1962,1961
Estas estatísticas em outros países:
AfghanistanAlbaniaAlgeriaAngolaAntigua and BarbudaArab WorldArgentinaArmeniaArubaAustraliaAustriaAzerbaijanBahamas, TheBahrainBangladeshBarbadosBelarusBelgiumBelizeBeninBhutanBoliviaBosnia and HerzegovinaBotswanaBrazilBrunei DarussalamBulgariaBurkina FasoBurundiCabo VerdeCambodiaCameroonCanadaCaribbean small statesCentral African RepublicCentral Europe and the BalticsChadChannel IslandsChileChinaColombiaComorosCongo, Dem. Rep.Congo, Rep.Costa RicaCote d'IvoireCroatiaCubaCuracaoCyprusCzech RepublicDenmarkDjiboutiDominican RepublicEarly-demographic dividendEast Asia & PacificEast Asia & Pacific (excluding high income)East Asia & Pacific (IDA & IBRD countries)EcuadorEgypt, Arab Rep.El SalvadorEquatorial GuineaEritreaEstoniaEthiopiaEuro areaEurope & Central AsiaEurope & Central Asia (excluding high income)Europe & Central Asia (IDA & IBRD countries)European UnionFijiFinlandFragile and conflict affected situationsFranceFrench PolynesiaGabonGambia, TheGeorgiaGermanyGhanaGreeceGrenadaGuamGuatemalaGuineaGuinea-BissauGuyanaHaitiHeavily indebted poor countries (HIPC)High incomeHondurasHong Kong SAR, ChinaHungaryIBRD onlyIcelandIDA & IBRD totalIDA blendIDA onlyIDA totalIndiaIndonesiaIran, Islamic Rep.IraqIrelandIsraelItalyJamaicaJapanJordanKazakhstanKenyaKiribatiKorea, Dem. People’s Rep.Korea, Rep.KuwaitKyrgyz RepublicLao PDRLate-demographic dividendLatin America & Caribbean Latin America & Caribbean (excluding high income)Latin America & the Caribbean (IDA & IBRD countries)LatviaLeast developed countries: UN classificationLebanonLesothoLiberiaLibyaLithuaniaLow & middle incomeLow incomeLower middle incomeLuxembourgMacao SAR, ChinaMacedonia, FYRMadagascarMalawiMalaysiaMaldivesMaliMaltaMauritaniaMauritiusMexicoMicronesia, Fed. Sts.Middle East & North AfricaMiddle East & North Africa (excluding high income)Middle East & North Africa (IDA & IBRD countries)Middle incomeMoldovaMongoliaMontenegroMoroccoMozambiqueMyanmarNamibiaNepalNetherlandsNew CaledoniaNew ZealandNicaraguaNigerNigeriaNorth AmericaNorwayOECD membersOmanOther small statesPacific island small statesPakistanPanamaPapua New GuineaParaguayPeruPhilippinesPolandPortugalPost-demographic dividendPre-demographic dividendPuerto RicoQatarRomaniaRussian FederationRwandaSamoaSao Tome and PrincipeSaudi ArabiaSenegalSerbiaSeychellesSierra LeoneSingaporeSlovak RepublicSloveniaSmall statesSolomon IslandsSomaliaSouth AfricaSouth AsiaSouth Asia (IDA & IBRD)South SudanSpainSri LankaSt. LuciaSt. Vincent and the GrenadinesSub-Saharan Africa Sub-Saharan Africa (excluding high income)Sub-Saharan Africa (IDA & IBRD countries)SudanSurinameSwazilandSwedenSwitzerlandSyrian Arab RepublicTajikistanTanzaniaThailandTimor-LesteTogoTongaTrinidad and TobagoTunisiaTurkeyTurkmenistanUgandaUkraineUnited Arab EmiratesUnited KingdomUnited StatesUpper middle incomeUruguayUzbekistanVanuatuVenezuela, RBVietnamVirgin Islands (U.S.)West Bank and GazaWorldYemen, Rep.ZambiaZimbabwe Linha do tempo:
Nesta escala de tempo está apresentado um gráfico de 1961 ano até 2015 ano Mozambique. Dados de 1960 ano ausente. O número de observações reais por data: 55.
Fonte (nome):
Indicadores de desenvolvimento mundial
Fonte (organização):
United Nations Population Division. World Population Prospects. New York, United Nations, Department of Economic and Social Affairs (advanced Excel tables). Available at http://esa.un.org/wpp/unpp/panel_population.htm.
Categorias:
Health, Gender
Foi atualizado:
23 abr 2017 ano
Indicadores de alterações dos valores ao longo dos anos
Mínimo:
21.921
1 jan 1961 ano
Máximo:
44.379
1 jan 2015 ano
Na data de observação
Valor
Mudança absoluta
A alteração em relação ao valor anterior
1 jan 1961 ano
21.921
+21.921
0.0%
1 jan 1962 ano
22.468
+0.547
2.5%
1 jan 1963 ano
23.016
+0.547
2.44%
1 jan 1964 ano
23.472
+0.456
1.98%
1 jan 1965 ano
23.928
+0.456
1.94%
1 jan 1966 ano
24.385
+0.456
1.91%
1 jan 1967 ano
24.841
+0.456
1.87%
1 jan 1968 ano
25.297
+0.456
1.84%
1 jan 1969 ano
25.844
+0.547
2.16%
1 jan 1970 ano
26.391
+0.547
2.12%
1 jan 1971 ano
26.938
+0.547
2.07%
1 jan 1972 ano
27.485
+0.547
2.03%
1 jan 1973 ano
28.032
+0.547
1.99%
1 jan 1974 ano
28.529
+0.496
1.77%
1 jan 1975 ano
29.025
+0.496
1.74%
1 jan 1976 ano
29.521
+0.496
1.71%
1 jan 1977 ano
30.018
+0.496
1.68%
1 jan 1978 ano
30.514
+0.496
1.65%
1 jan 1979 ano
30.331
-0.183
-0.6%
1 jan 1980 ano
30.147
-0.183
-0.6%
1 jan 1981 ano
29.964
-0.183
-0.61%
1 jan 1982 ano
29.78
-0.183
-0.61%
1 jan 1983 ano
29.597
-0.183
-0.62%
1 jan 1984 ano
29.855
+0.258
0.87%
1 jan 1985 ano
30.113
+0.258
0.86%
1 jan 1986 ano
30.371
+0.258
0.86%
1 jan 1987 ano
30.63
+0.258
0.85%
1 jan 1988 ano
30.888
+0.258
0.84%
1 jan 1989 ano
31.305
+0.417
1.35%
1 jan 1990 ano
31.721
+0.417
1.33%
1 jan 1991 ano
32.138
+0.417
1.31%
1 jan 1992 ano
32.555
+0.417
1.3%
1 jan 1993 ano
32.972
+0.417
1.28%
1 jan 1994 ano
33.653
+0.681
2.07%
1 jan 1995 ano
34.335
+0.681
2.02%
1 jan 1996 ano
35.016
+0.681
1.98%
1 jan 1997 ano
35.697
+0.681
1.95%
1 jan 1998 ano
36.379
+0.681
1.91%
1 jan 1999 ano
36.505
+0.126
0.35%
1 jan 2000 ano
36.631
+0.126
0.35%
1 jan 2001 ano
36.757
+0.126
0.34%
1 jan 2002 ano
36.883
+0.126
0.34%
1 jan 2003 ano
37.009
+0.126
0.34%
1 jan 2004 ano
37.536
+0.528
1.43%
1 jan 2005 ano
38.064
+0.528
1.41%
1 jan 2006 ano
38.592
+0.528
1.39%
1 jan 2007 ano
39.119
+0.528
1.37%
1 jan 2008 ano
39.647
+0.528
1.35%
1 jan 2009 ano
40.376
+0.729
1.84%
1 jan 2010 ano
41.105
+0.729
1.81%
1 jan 2011 ano
41.834
+0.729
1.77%
1 jan 2012 ano
42.564
+0.729
1.74%
1 jan 2013 ano
43.293
+0.729
1.71%
1 jan 2014 ano
43.836
+0.543
1.25%
1 jan 2015 ano
44.379
+0.543
1.24%
Classificação de países por estatísticas atuais por anos


Comentários: