29
/pt/
pt
AIzaSyAYiBZKx7MnpbEhh9jyipgxe19OcubqV5w
April 1, 2024
228537
Romania
ROU
true
2
1
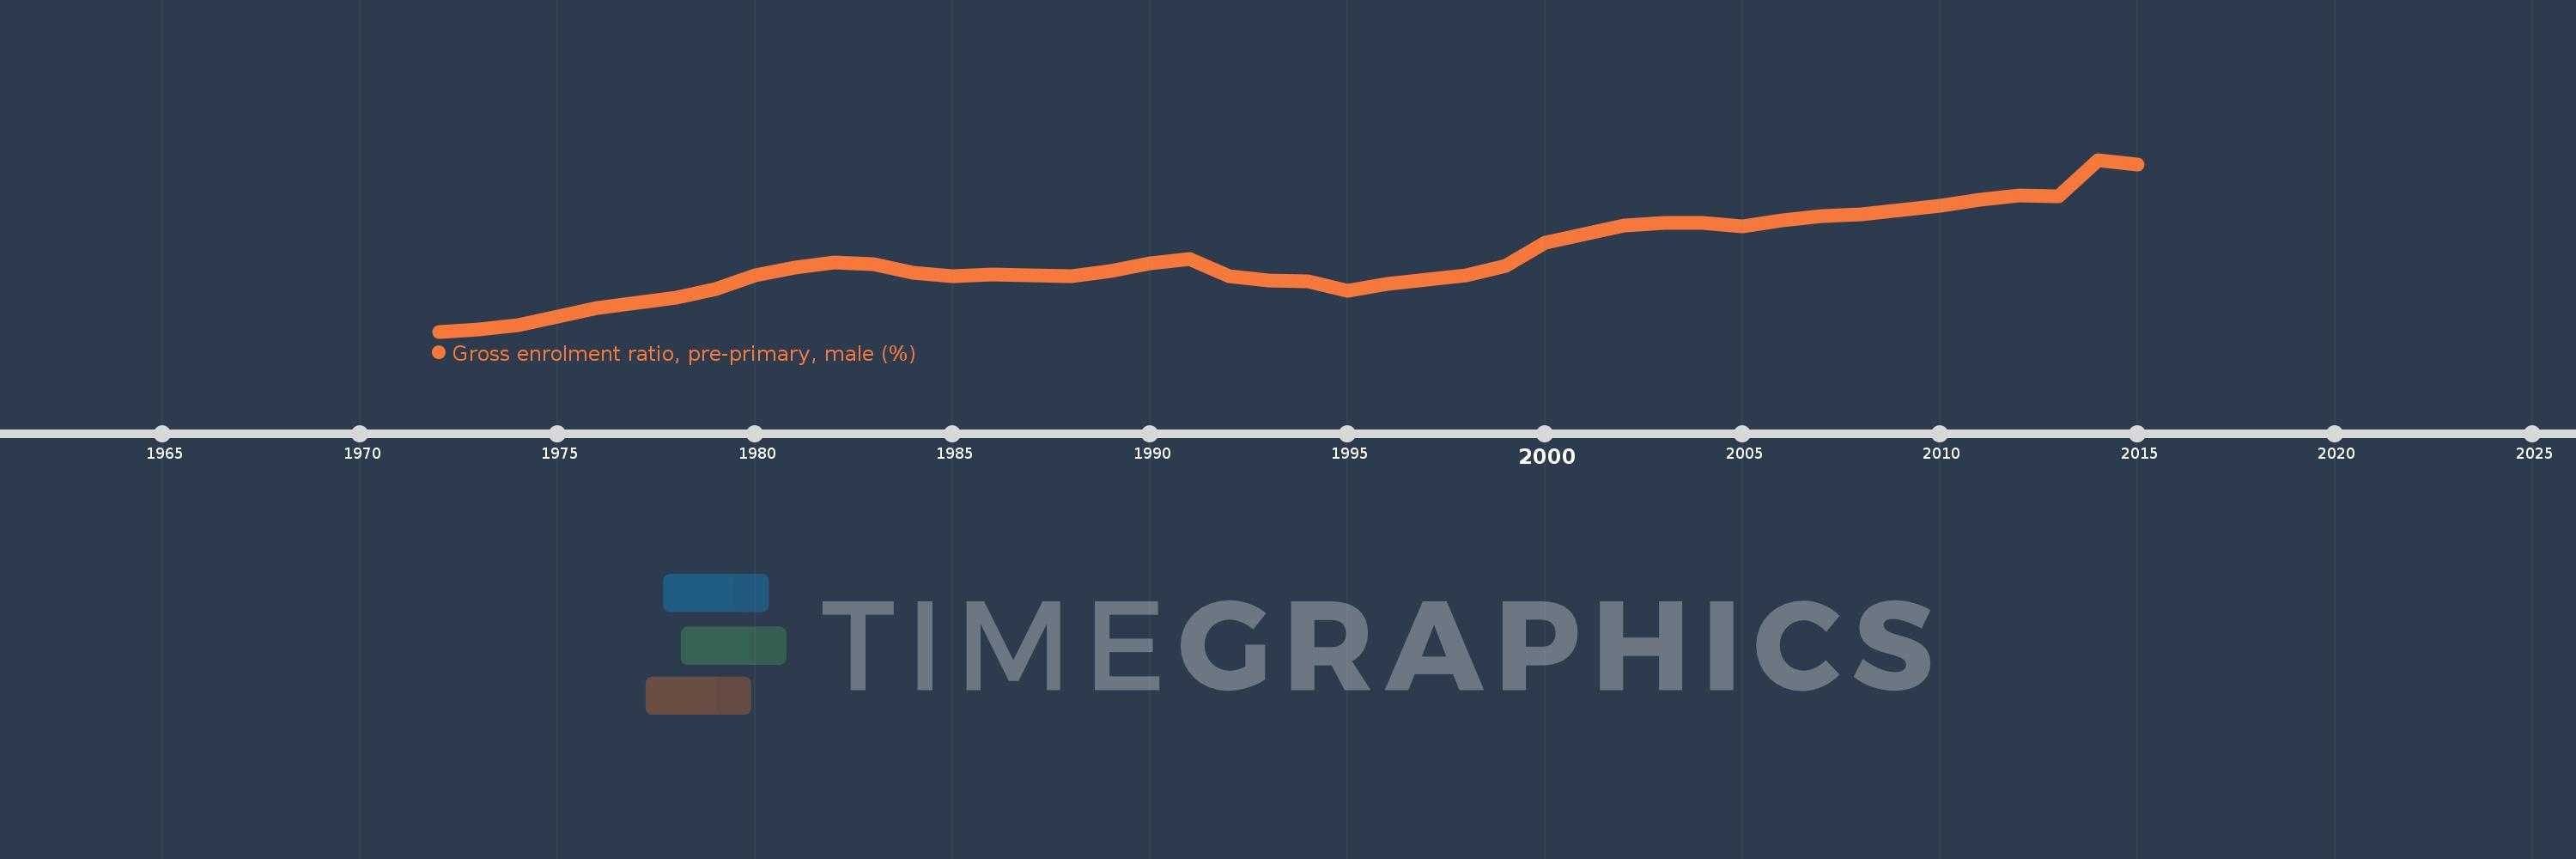
Gross enrolment ratio, pre-primary, male (%)
2015,2014,2013,2012,2011,2010,2009,2008,2007,2006,2005,2004,2003,2002,2001,2000,1999,1998,1997,1996,1995,1994,1993,1992,1991,1990,1989,1988,1987,1986,1985,1984,1983,1982,1981,1980,1979,1978,1977,1976,1975,1974,1973,1972
Estas estatísticas em outros países:
AfghanistanAlbaniaAlgeriaAndorraAngolaAntigua and BarbudaArab WorldArgentinaArmeniaArubaAustraliaAustriaAzerbaijanBahamas, TheBahrainBangladeshBarbadosBelarusBelgiumBelizeBeninBermudaBhutanBoliviaBosnia and HerzegovinaBotswanaBrazilBrunei DarussalamBulgariaBurkina FasoBurundiCabo VerdeCambodiaCameroonCanadaCaribbean small statesCentral African RepublicCentral Europe and the BalticsChadChileChinaColombiaComorosCongo, Dem. Rep.Congo, Rep.Costa RicaCote d'IvoireCroatiaCubaCyprusCzech RepublicDenmarkDjiboutiDominicaDominican RepublicEarly-demographic dividendEast Asia & PacificEast Asia & Pacific (excluding high income)East Asia & Pacific (IDA & IBRD countries)EcuadorEgypt, Arab Rep.El SalvadorEquatorial GuineaEritreaEstoniaEthiopiaEuro areaEurope & Central AsiaEurope & Central Asia (excluding high income)Europe & Central Asia (IDA & IBRD countries)European UnionFijiFinlandFragile and conflict affected situationsFranceGabonGambia, TheGeorgiaGermanyGhanaGreeceGrenadaGuatemalaGuineaGuinea-BissauGuyanaHeavily indebted poor countries (HIPC)High incomeHondurasHong Kong SAR, ChinaHungaryIBRD onlyIcelandIDA & IBRD totalIDA blendIDA onlyIDA totalIndiaIndonesiaIran, Islamic Rep.IraqIrelandIsraelItalyJamaicaJapanJordanKazakhstanKenyaKorea, Dem. People’s Rep.Korea, Rep.KuwaitKyrgyz RepublicLao PDRLate-demographic dividendLatin America & Caribbean Latin America & Caribbean (excluding high income)Latin America & the Caribbean (IDA & IBRD countries)LatviaLeast developed countries: UN classificationLebanonLesothoLiberiaLibyaLiechtensteinLithuaniaLow & middle incomeLow incomeLower middle incomeLuxembourgMacao SAR, ChinaMacedonia, FYRMadagascarMaldivesMaliMaltaMarshall IslandsMauritaniaMauritiusMexicoMicronesia, Fed. Sts.Middle East & North AfricaMiddle East & North Africa (excluding high income)Middle East & North Africa (IDA & IBRD countries)Middle incomeMoldovaMongoliaMontenegroMoroccoMozambiqueMyanmarNamibiaNauruNepalNetherlandsNew ZealandNicaraguaNigerNigeriaNorth AmericaNorwayOECD membersOmanOther small statesPacific island small statesPakistanPalauPanamaPapua New GuineaParaguayPeruPhilippinesPolandPortugalPost-demographic dividendPre-demographic dividendPuerto RicoQatarRomaniaRussian FederationRwandaSamoaSan MarinoSao Tome and PrincipeSaudi ArabiaSenegalSerbiaSeychellesSierra LeoneSlovak RepublicSloveniaSmall statesSolomon IslandsSomaliaSouth AfricaSouth AsiaSouth Asia (IDA & IBRD)South SudanSpainSri LankaSt. Kitts and NevisSt. LuciaSt. Vincent and the GrenadinesSub-Saharan Africa Sub-Saharan Africa (excluding high income)Sub-Saharan Africa (IDA & IBRD countries)SudanSurinameSwazilandSwedenSwitzerlandSyrian Arab RepublicTajikistanTanzaniaThailandTimor-LesteTogoTongaTrinidad and TobagoTunisiaTurkeyTurkmenistanTuvaluUgandaUkraineUnited Arab EmiratesUnited KingdomUnited StatesUpper middle incomeUruguayUzbekistanVanuatuVenezuela, RBVietnamWest Bank and GazaWorldYemen, Rep.Zimbabwe Linha do tempo:
Nesta escala de tempo está apresentado um gráfico de 1972 ano até 2015 ano Romania. Dados de 1971 ano ausente. O número de observações reais por data: 44.
Fonte (nome):
Indicadores de desenvolvimento mundial
Fonte (organização):
UNESCO Institute for Statistics
Categorias:
Education, Gender
Foi atualizado:
23 abr 2017 ano
Indicadores de alterações dos valores ao longo dos anos
Mínimo:
35.849
1 jan 1972 ano
Máximo:
92.021
1 jan 2014 ano
Na data de observação
Valor
Mudança absoluta
A alteração em relação ao valor anterior
1 jan 1972 ano
35.849
+35.849
0.0%
1 jan 1973 ano
36.644
+0.795
2.22%
1 jan 1974 ano
38.051
+1.407
3.84%
1 jan 1975 ano
40.673
+2.622
6.89%
1 jan 1976 ano
43.468
+2.794
6.87%
1 jan 1977 ano
45.319
+1.852
4.26%
1 jan 1978 ano
46.968
+1.649
3.64%
1 jan 1979 ano
49.761
+2.794
5.95%
1 jan 1980 ano
54.34
+4.579
9.2%
1 jan 1981 ano
56.657
+2.317
4.26%
1 jan 1982 ano
58.568
+1.911
3.37%
1 jan 1983 ano
57.829
-0.739
-1.26%
1 jan 1984 ano
55.208
-2.621
-4.53%
1 jan 1985 ano
53.984
-1.225
-2.22%
1 jan 1986 ano
54.537
+0.553
1.02%
1 jan 1987 ano
54.138
-0.399
-0.73%
1 jan 1988 ano
53.955
-0.183
-0.34%
1 jan 1989 ano
55.699
+1.744
3.23%
1 jan 1990 ano
58.241
+2.541
4.56%
1 jan 1991 ano
59.455
+1.214
2.08%
1 jan 1992 ano
53.85
-5.605
-9.43%
1 jan 1993 ano
52.632
-1.218
-2.26%
1 jan 1994 ano
52.246
-0.386
-0.73%
1 jan 1995 ano
49.158
-3.089
-5.91%
1 jan 1996 ano
51.353
+2.195
4.47%
1 jan 1997 ano
52.765
+1.412
2.75%
1 jan 1998 ano
54.361
+1.596
3.02%
1 jan 1999 ano
57.438
+3.077
5.66%
1 jan 2000 ano
64.856
+7.418
12.91%
1 jan 2001 ano
67.646
+2.79
4.3%
1 jan 2002 ano
70.528
+2.882
4.26%
1 jan 2003 ano
71.468
+0.941
1.33%
1 jan 2004 ano
71.473
+0.004
0.01%
1 jan 2005 ano
70.32
-1.153
-1.61%
1 jan 2006 ano
72.253
+1.933
2.75%
1 jan 2007 ano
73.574
+1.321
1.83%
1 jan 2008 ano
74.288
+0.714
0.97%
1 jan 2009 ano
75.684
+1.395
1.88%
1 jan 2010 ano
77.059
+1.376
1.82%
1 jan 2011 ano
78.995
+1.936
2.51%
1 jan 2012 ano
80.267
+1.272
1.61%
1 jan 2013 ano
80.146
-0.121
-0.15%
1 jan 2014 ano
92.021
+11.875
14.82%
1 jan 2015 ano
90.365
-1.657
-1.8%
Classificação de países por estatísticas atuais por anos


Comentários: