29
/pt/
pt
AIzaSyAYiBZKx7MnpbEhh9jyipgxe19OcubqV5w
April 1, 2024
110992
Congo, Rep.
COG
true
2
1
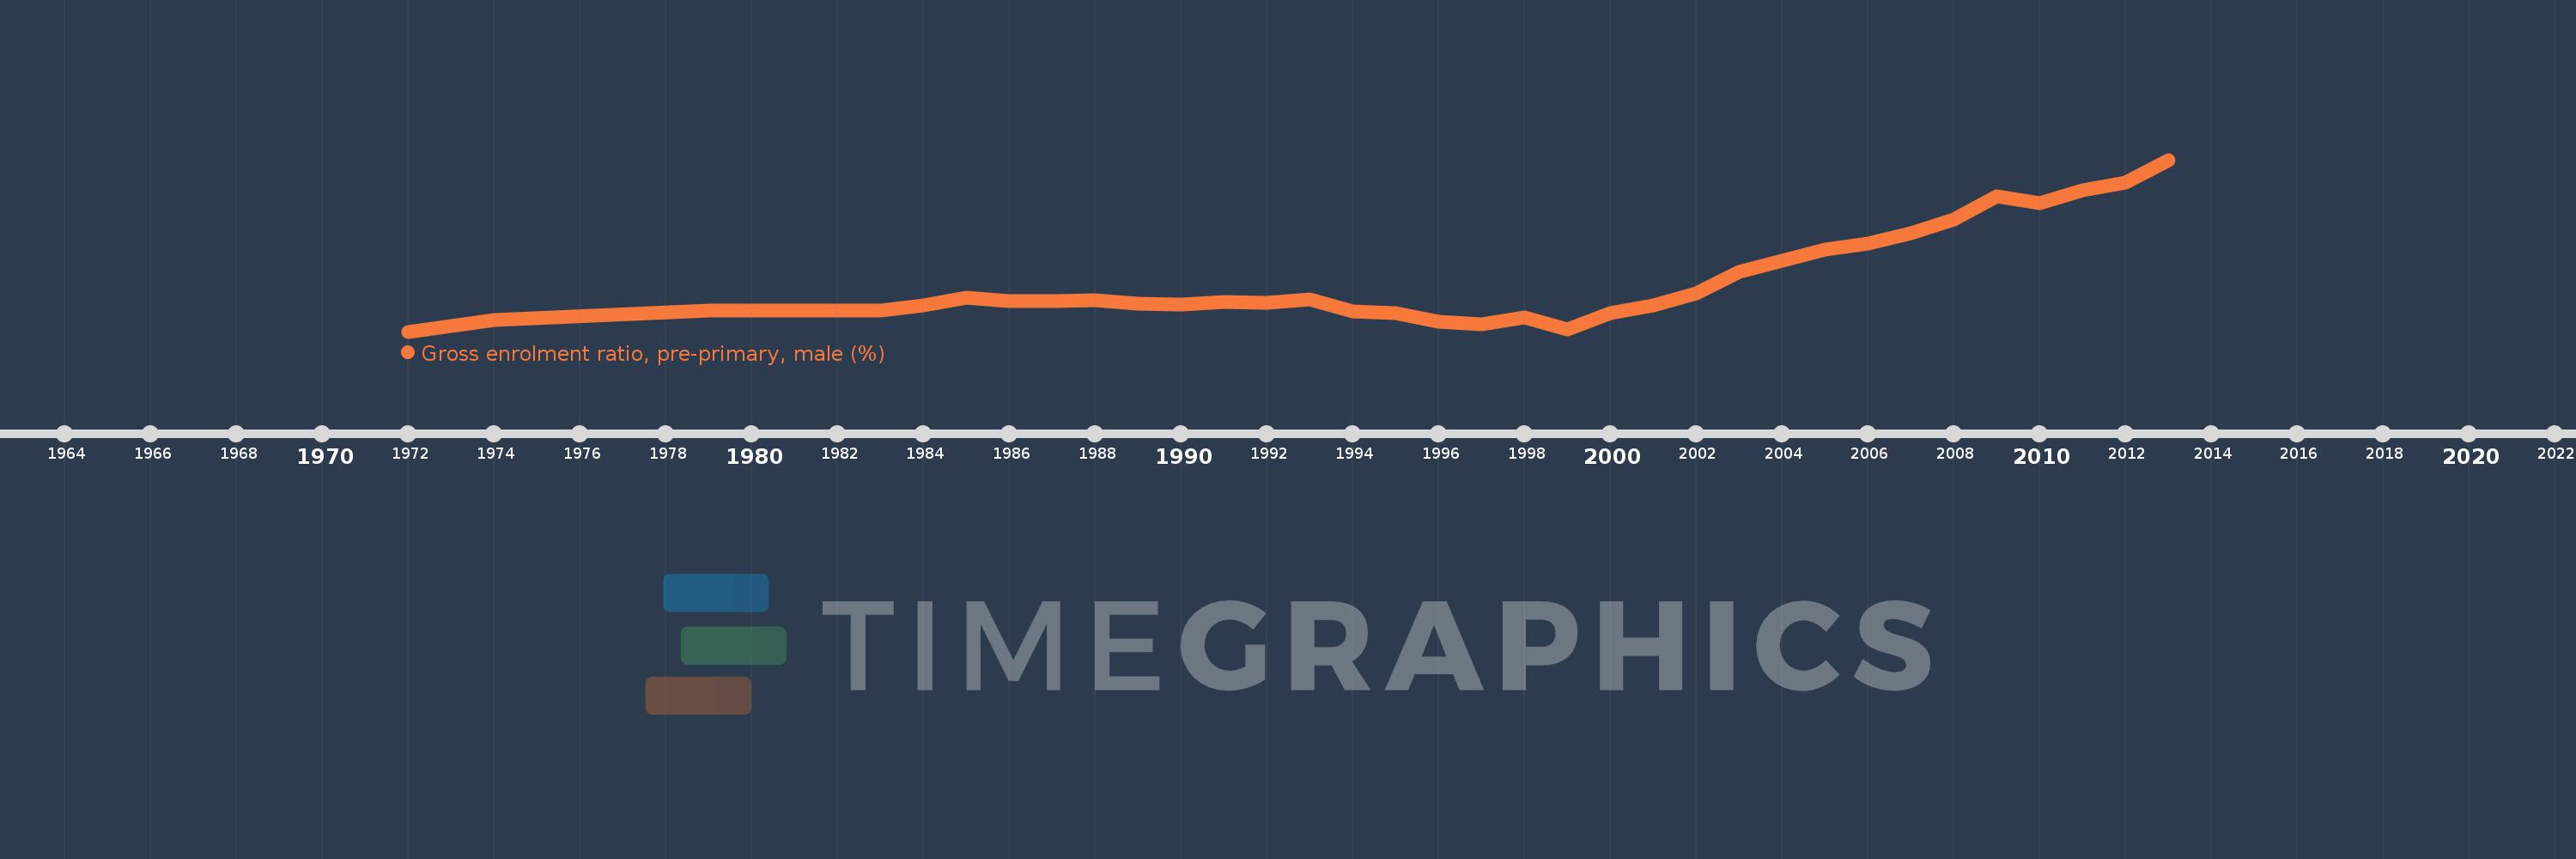
Gross enrolment ratio, pre-primary, male (%)
2013,2012,2011,2010,2009,2008,2007,2006,2005,2004,2003,2002,2001,2000,1999,1998,1997,1996,1995,1994,1993,1992,1991,1990,1989,1988,1987,1986,1985,1984,1983,1982,1979,1974,1972
Estas estatísticas em outros países:
AfghanistanAlbaniaAlgeriaAndorraAngolaAntigua and BarbudaArab WorldArgentinaArmeniaArubaAustraliaAustriaAzerbaijanBahamas, TheBahrainBangladeshBarbadosBelarusBelgiumBelizeBeninBermudaBhutanBoliviaBosnia and HerzegovinaBotswanaBrazilBrunei DarussalamBulgariaBurkina FasoBurundiCabo VerdeCambodiaCameroonCanadaCaribbean small statesCentral African RepublicCentral Europe and the BalticsChadChileChinaColombiaComorosCongo, Dem. Rep.Congo, Rep.Costa RicaCote d'IvoireCroatiaCubaCyprusCzech RepublicDenmarkDjiboutiDominicaDominican RepublicEarly-demographic dividendEast Asia & PacificEast Asia & Pacific (excluding high income)East Asia & Pacific (IDA & IBRD countries)EcuadorEgypt, Arab Rep.El SalvadorEquatorial GuineaEritreaEstoniaEthiopiaEuro areaEurope & Central AsiaEurope & Central Asia (excluding high income)Europe & Central Asia (IDA & IBRD countries)European UnionFijiFinlandFragile and conflict affected situationsFranceGabonGambia, TheGeorgiaGermanyGhanaGreeceGrenadaGuatemalaGuineaGuinea-BissauGuyanaHeavily indebted poor countries (HIPC)High incomeHondurasHong Kong SAR, ChinaHungaryIBRD onlyIcelandIDA & IBRD totalIDA blendIDA onlyIDA totalIndiaIndonesiaIran, Islamic Rep.IraqIrelandIsraelItalyJamaicaJapanJordanKazakhstanKenyaKorea, Dem. People’s Rep.Korea, Rep.KuwaitKyrgyz RepublicLao PDRLate-demographic dividendLatin America & Caribbean Latin America & Caribbean (excluding high income)Latin America & the Caribbean (IDA & IBRD countries)LatviaLeast developed countries: UN classificationLebanonLesothoLiberiaLibyaLiechtensteinLithuaniaLow & middle incomeLow incomeLower middle incomeLuxembourgMacao SAR, ChinaMacedonia, FYRMadagascarMaldivesMaliMaltaMarshall IslandsMauritaniaMauritiusMexicoMicronesia, Fed. Sts.Middle East & North AfricaMiddle East & North Africa (excluding high income)Middle East & North Africa (IDA & IBRD countries)Middle incomeMoldovaMongoliaMontenegroMoroccoMozambiqueMyanmarNamibiaNauruNepalNetherlandsNew ZealandNicaraguaNigerNigeriaNorth AmericaNorwayOECD membersOmanOther small statesPacific island small statesPakistanPalauPanamaPapua New GuineaParaguayPeruPhilippinesPolandPortugalPost-demographic dividendPre-demographic dividendPuerto RicoQatarRomaniaRussian FederationRwandaSamoaSan MarinoSao Tome and PrincipeSaudi ArabiaSenegalSerbiaSeychellesSierra LeoneSlovak RepublicSloveniaSmall statesSolomon IslandsSomaliaSouth AfricaSouth AsiaSouth Asia (IDA & IBRD)South SudanSpainSri LankaSt. Kitts and NevisSt. LuciaSt. Vincent and the GrenadinesSub-Saharan Africa Sub-Saharan Africa (excluding high income)Sub-Saharan Africa (IDA & IBRD countries)SudanSurinameSwazilandSwedenSwitzerlandSyrian Arab RepublicTajikistanTanzaniaThailandTimor-LesteTogoTongaTrinidad and TobagoTunisiaTurkeyTurkmenistanTuvaluUgandaUkraineUnited Arab EmiratesUnited KingdomUnited StatesUpper middle incomeUruguayUzbekistanVanuatuVenezuela, RBVietnamWest Bank and GazaWorldYemen, Rep.Zimbabwe Linha do tempo:
Nesta escala de tempo está apresentado um gráfico de 1972 ano até 2013 ano Congo, Rep.. Dados de 1971 ano ausente. O número de observações reais por data: 35.
Fonte (nome):
Indicadores de desenvolvimento mundial
Fonte (organização):
UNESCO Institute for Statistics
Categorias:
Education, Gender
Foi atualizado:
23 abr 2017 ano
Indicadores de alterações dos valores ao longo dos anos
Mínimo:
0.311
1 jan 1972 ano
Máximo:
13.987
1 jan 2013 ano
Na data de observação
Valor
Mudança absoluta
A alteração em relação ao valor anterior
1 jan 1972 ano
0.311
+0.311
0.0%
1 jan 1974 ano
1.255
+0.944
303.21%
1 jan 1979 ano
2.015
+0.76
60.57%
1 jan 1982 ano
1.953
-0.062
-3.08%
1 jan 1983 ano
1.959
+0.006
0.31%
1 jan 1984 ano
2.365
+0.407
20.76%
1 jan 1985 ano
2.988
+0.623
26.33%
1 jan 1986 ano
2.756
-0.232
-7.78%
1 jan 1987 ano
2.765
+0.009
0.32%
1 jan 1988 ano
2.818
+0.053
1.93%
1 jan 1989 ano
2.515
-0.303
-10.77%
1 jan 1990 ano
2.468
-0.046
-1.84%
1 jan 1991 ano
2.678
+0.21
8.51%
1 jan 1992 ano
2.599
-0.079
-2.96%
1 jan 1993 ano
2.907
+0.308
11.83%
1 jan 1994 ano
1.914
-0.993
-34.14%
1 jan 1995 ano
1.776
-0.138
-7.2%
1 jan 1996 ano
1.087
-0.69
-38.82%
1 jan 1997 ano
0.884
-0.203
-18.63%
1 jan 1998 ano
1.42
+0.536
60.57%
1 jan 1999 ano
0.469
-0.951
-66.96%
1 jan 2000 ano
1.76
+1.291
275.18%
1 jan 2001 ano
2.363
+0.603
34.26%
1 jan 2002 ano
3.351
+0.988
41.82%
1 jan 2003 ano
5.092
+1.741
51.95%
1 jan 2004 ano
5.958
+0.865
17.0%
1 jan 2005 ano
6.834
+0.877
14.72%
1 jan 2006 ano
7.308
+0.473
6.93%
1 jan 2007 ano
8.127
+0.819
11.21%
1 jan 2008 ano
9.202
+1.075
13.23%
1 jan 2009 ano
11.072
+1.87
20.33%
1 jan 2010 ano
10.541
-0.531
-4.8%
1 jan 2011 ano
11.547
+1.005
9.54%
1 jan 2012 ano
12.177
+0.63
5.46%
1 jan 2013 ano
13.987
+1.81
14.86%
Classificação de países por estatísticas atuais por anos


Comentários: