29
/pt/
pt
AIzaSyAYiBZKx7MnpbEhh9jyipgxe19OcubqV5w
April 1, 2024
223977
Philippines
PHL
true
2
1
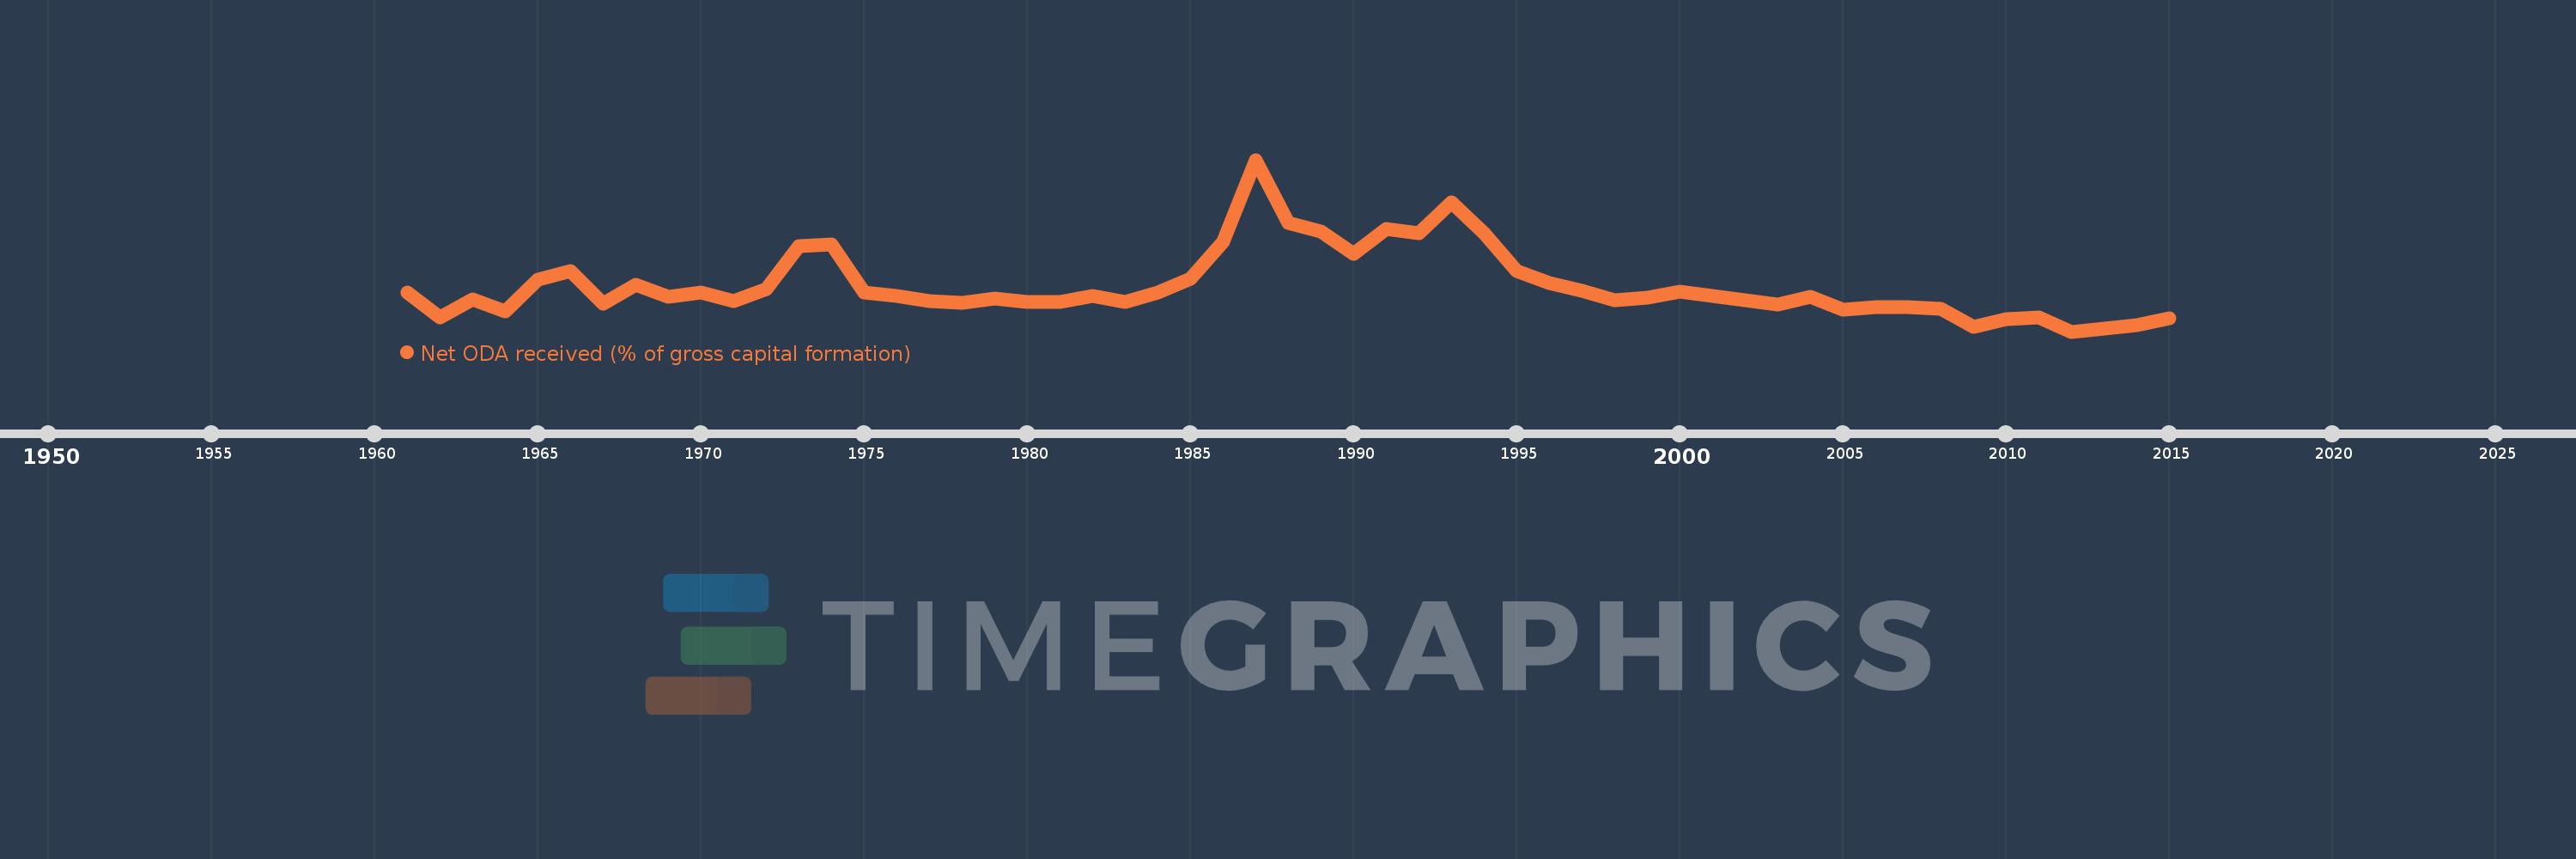
Net ODA received (% of gross capital formation)
2015,2014,2013,2012,2011,2010,2009,2008,2007,2006,2005,2004,2003,2002,2001,2000,1999,1998,1997,1996,1995,1994,1993,1992,1991,1990,1989,1988,1987,1986,1985,1984,1983,1982,1981,1980,1979,1978,1977,1976,1975,1974,1973,1972,1971,1970,1969,1968,1967,1966,1965,1964,1963,1962,1961
Estas estatísticas em outros países:
AfghanistanAlbaniaAlgeriaAngolaAntigua and BarbudaArab WorldArgentinaArmeniaArubaAzerbaijanBahamas, TheBahrainBangladeshBarbadosBelarusBelizeBeninBhutanBoliviaBosnia and HerzegovinaBotswanaBrazilBrunei DarussalamBurkina FasoBurundiCabo VerdeCambodiaCameroonCaribbean small statesCentral African RepublicCentral Europe and the BalticsChadChileChinaColombiaComorosCongo, Dem. Rep.Congo, Rep.Costa RicaCote d'IvoireCroatiaCubaCyprusDjiboutiDominicaDominican RepublicEast Asia & PacificEast Asia & Pacific (excluding high income)East Asia & Pacific (IDA & IBRD countries)EcuadorEgypt, Arab Rep.El SalvadorEquatorial GuineaEritreaEthiopiaEuro areaEurope & Central AsiaEurope & Central Asia (excluding high income)Europe & Central Asia (IDA & IBRD countries)European UnionFijiFragile and conflict affected situationsGabonGambia, TheGeorgiaGhanaGrenadaGuatemalaGuineaGuinea-BissauGuyanaHaitiHeavily indebted poor countries (HIPC)High incomeHondurasHong Kong SAR, ChinaIBRD onlyIDA & IBRD totalIDA blendIDA onlyIDA totalIndiaIndonesiaIran, Islamic Rep.IraqIsraelJamaicaJordanKazakhstanKenyaKiribatiKorea, Rep.KosovoKuwaitKyrgyz RepublicLao PDRLatin America & Caribbean Latin America & Caribbean (excluding high income)Latin America & the Caribbean (IDA & IBRD countries)Least developed countries: UN classificationLebanonLesothoLiberiaLibyaLow & middle incomeLow incomeLower middle incomeMacao SAR, ChinaMacedonia, FYRMadagascarMalawiMalaysiaMaldivesMaliMaltaMauritaniaMauritiusMexicoMiddle East & North AfricaMiddle East & North Africa (excluding high income)Middle East & North Africa (IDA & IBRD countries)Middle incomeMoldovaMongoliaMontenegroMoroccoMozambiqueNamibiaNepalNew CaledoniaNicaraguaNigerNigeriaNorth AmericaOECD membersOmanOther small statesPakistanPanamaPapua New GuineaParaguayPeruPhilippinesQatarRwandaSaudi ArabiaSenegalSerbiaSeychellesSierra LeoneSingaporeSloveniaSmall statesSolomon IslandsSouth AfricaSouth AsiaSouth Asia (IDA & IBRD)South SudanSri LankaSt. Kitts and NevisSt. LuciaSt. Vincent and the GrenadinesSub-Saharan Africa Sub-Saharan Africa (excluding high income)Sub-Saharan Africa (IDA & IBRD countries)SudanSurinameSwazilandSyrian Arab RepublicTajikistanTanzaniaThailandTimor-LesteTogoTongaTrinidad and TobagoTunisiaTurkeyTurkmenistanUgandaUkraineUpper middle incomeUruguayUzbekistanVanuatuVenezuela, RBVietnamWest Bank and GazaWorldYemen, Rep.ZambiaZimbabwe Linha do tempo:
Nesta escala de tempo está apresentado um gráfico de 1961 ano até 2015 ano Philippines. Dados de 1960 ano ausente. O número de observações reais por data: 55.
Fonte (nome):
Indicadores de desenvolvimento mundial
Fonte (organização):
Development Assistance Committee of the Organisation for Economic Co-operation and Development, Geographical Distribution of Financial Flows to Developing Countries, Development Co-operation Report, and International Development Statistics database. Data are available online at: www.oecd.org/dac/stats/idsonline. World Bank gross capital formation estimates are used for the denominator.
Categorias:
Aid Effectiveness
Foi atualizado:
23 abr 2017 ano
Indicadores de alterações dos valores ao longo dos anos
Mínimo:
-0.4
1 jan 2012 ano
Máximo:
20.193
1 jan 1987 ano
Na data de observação
Valor
Mudança absoluta
A alteração em relação ao valor anterior
1 jan 1961 ano
4.284
+4.284
0.0%
1 jan 1962 ano
1.287
-2.997
-69.95%
1 jan 1963 ano
3.442
+2.154
167.31%
1 jan 1964 ano
2.046
-1.396
-40.55%
1 jan 1965 ano
5.838
+3.792
185.35%
1 jan 1966 ano
6.815
+0.977
16.73%
1 jan 1967 ano
2.969
-3.846
-56.44%
1 jan 1968 ano
5.177
+2.208
74.35%
1 jan 1969 ano
3.803
-1.373
-26.53%
1 jan 1970 ano
4.283
+0.479
12.6%
1 jan 1971 ano
3.226
-1.057
-24.68%
1 jan 1972 ano
4.677
+1.451
44.98%
1 jan 1973 ano
9.811
+5.134
109.78%
1 jan 1974 ano
10.099
+0.288
2.94%
1 jan 1975 ano
4.24
-5.859
-58.02%
1 jan 1976 ano
3.848
-0.392
-9.24%
1 jan 1977 ano
3.293
-0.556
-14.44%
1 jan 1978 ano
3.01
-0.282
-8.57%
1 jan 1979 ano
3.542
+0.531
17.65%
1 jan 1980 ano
3.149
-0.393
-11.09%
1 jan 1981 ano
3.163
+0.014
0.45%
1 jan 1982 ano
3.829
+0.666
21.06%
1 jan 1983 ano
3.197
-0.632
-16.51%
1 jan 1984 ano
4.305
+1.108
34.66%
1 jan 1985 ano
5.948
+1.643
38.17%
1 jan 1986 ano
10.405
+4.457
74.93%
1 jan 1987 ano
20.193
+9.788
94.07%
1 jan 1988 ano
12.581
-7.612
-37.7%
1 jan 1989 ano
11.581
-1.0
-7.94%
1 jan 1990 ano
8.943
-2.638
-22.78%
1 jan 1991 ano
11.873
+2.93
32.76%
1 jan 1992 ano
11.437
-0.436
-3.67%
1 jan 1993 ano
15.123
+3.686
32.22%
1 jan 1994 ano
11.354
-3.769
-24.92%
1 jan 1995 ano
6.834
-4.52
-39.81%
1 jan 1996 ano
5.423
-1.412
-20.65%
1 jan 1997 ano
4.514
-0.908
-16.75%
1 jan 1998 ano
3.332
-1.182
-26.18%
1 jan 1999 ano
3.636
+0.303
9.09%
1 jan 2000 ano
4.361
+0.725
19.95%
1 jan 2001 ano
3.842
-0.519
-11.91%
1 jan 2002 ano
3.369
-0.472
-12.3%
1 jan 2003 ano
2.859
-0.51
-15.14%
1 jan 2004 ano
3.744
+0.885
30.94%
1 jan 2005 ano
2.274
-1.47
-39.27%
1 jan 2006 ano
2.553
+0.279
12.28%
1 jan 2007 ano
2.567
+0.014
0.53%
1 jan 2008 ano
2.356
-0.211
-8.21%
1 jan 2009 ano
0.143
-2.213
-93.94%
1 jan 2010 ano
1.107
+0.964
675.27%
1 jan 2011 ano
1.292
+0.185
16.71%
1 jan 2012 ano
-0.4
-1.693
-130.97%
1 jan 2013 ano
-0.006
+0.395
-98.58%
1 jan 2014 ano
0.35
+0.356
-6.28 mil%
1 jan 2015 ano
1.156
+0.806
230.22%
Classificação de países por estatísticas atuais por anos


Comentários: