29
/pt/
pt
AIzaSyAYiBZKx7MnpbEhh9jyipgxe19OcubqV5w
April 1, 2024
203305
Mozambique
MOZ
true
2
1
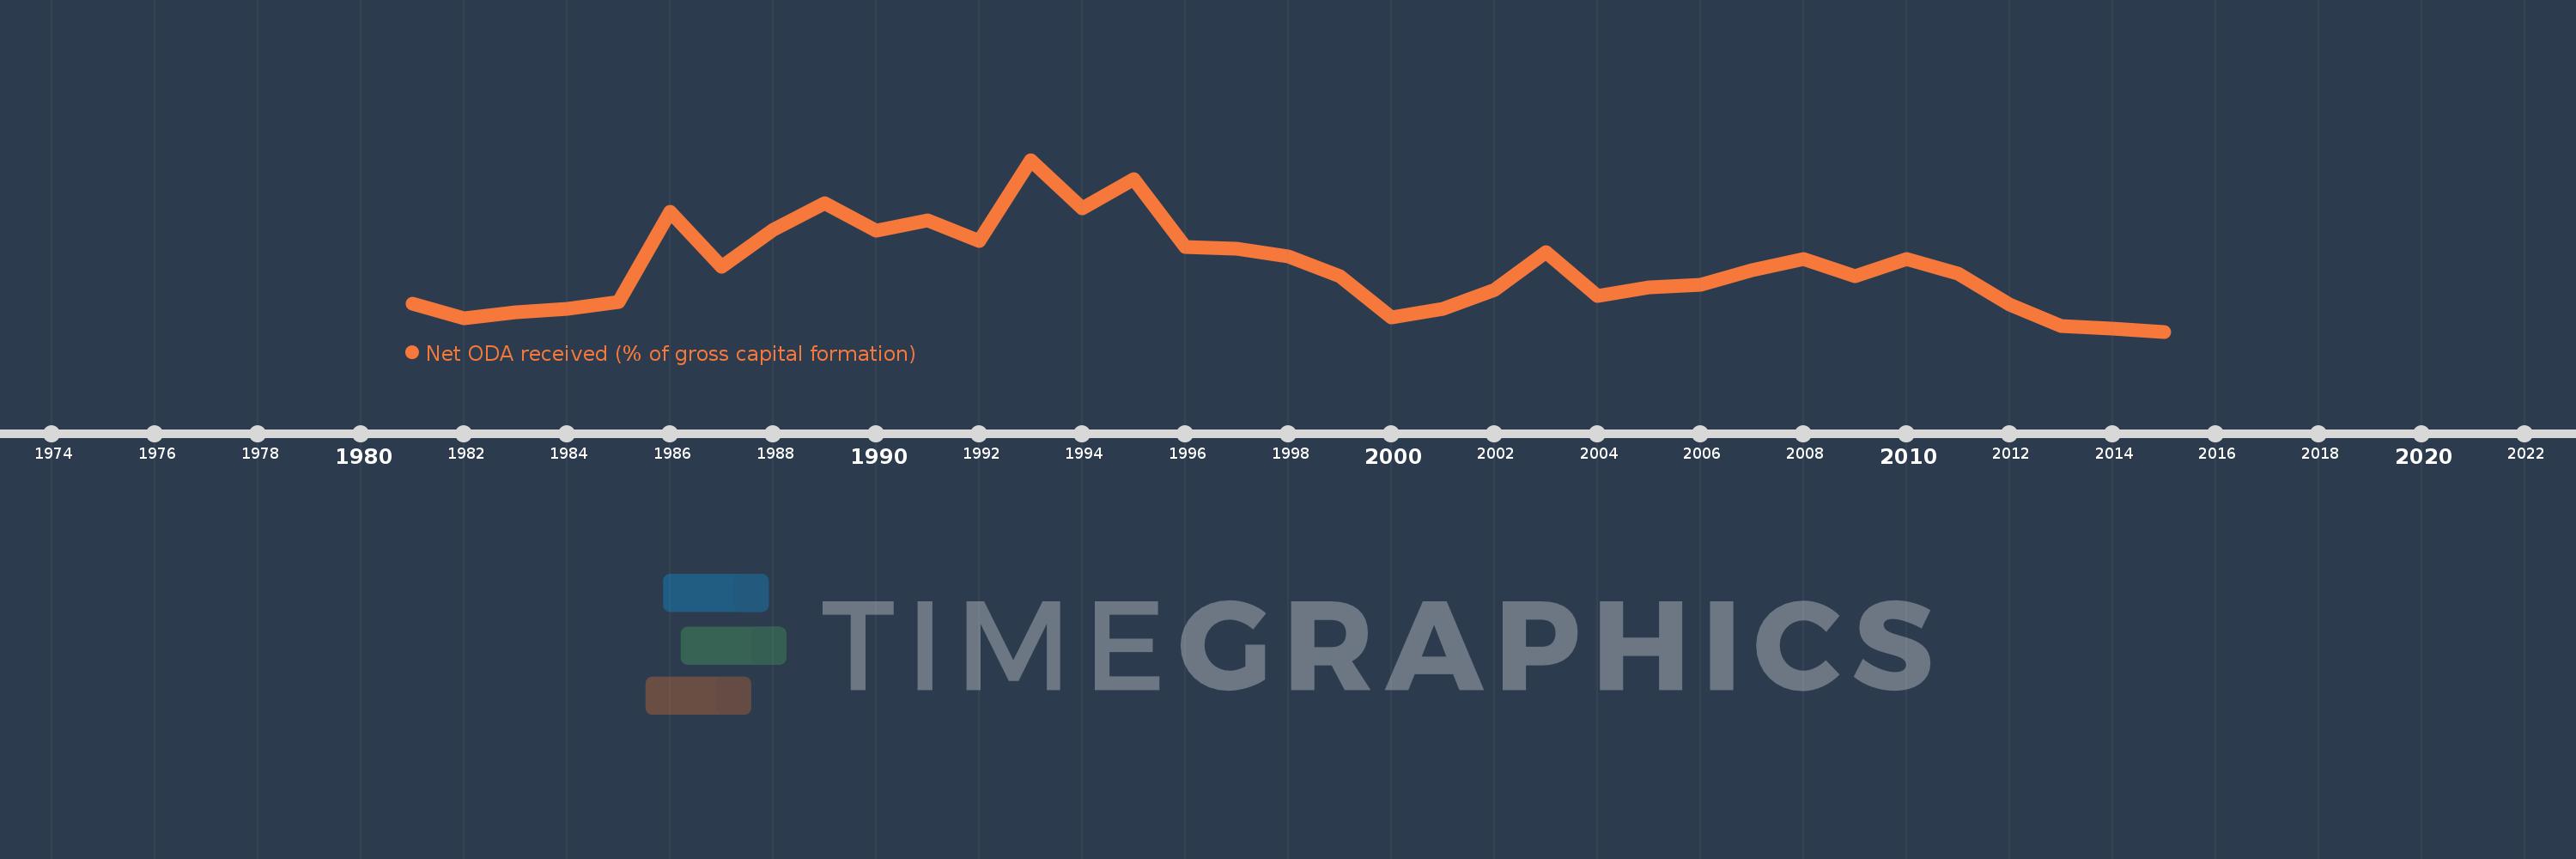
Net ODA received (% of gross capital formation)
2015,2014,2013,2012,2011,2010,2009,2008,2007,2006,2005,2004,2003,2002,2001,2000,1999,1998,1997,1996,1995,1994,1993,1992,1991,1990,1989,1988,1987,1986,1985,1984,1983,1982,1981
Estas estatísticas em outros países:
AfghanistanAlbaniaAlgeriaAngolaAntigua and BarbudaArab WorldArgentinaArmeniaArubaAzerbaijanBahamas, TheBahrainBangladeshBarbadosBelarusBelizeBeninBhutanBoliviaBosnia and HerzegovinaBotswanaBrazilBrunei DarussalamBurkina FasoBurundiCabo VerdeCambodiaCameroonCaribbean small statesCentral African RepublicCentral Europe and the BalticsChadChileChinaColombiaComorosCongo, Dem. Rep.Congo, Rep.Costa RicaCote d'IvoireCroatiaCubaCyprusDjiboutiDominicaDominican RepublicEast Asia & PacificEast Asia & Pacific (excluding high income)East Asia & Pacific (IDA & IBRD countries)EcuadorEgypt, Arab Rep.El SalvadorEquatorial GuineaEritreaEthiopiaEuro areaEurope & Central AsiaEurope & Central Asia (excluding high income)Europe & Central Asia (IDA & IBRD countries)European UnionFijiFragile and conflict affected situationsGabonGambia, TheGeorgiaGhanaGrenadaGuatemalaGuineaGuinea-BissauGuyanaHaitiHeavily indebted poor countries (HIPC)High incomeHondurasHong Kong SAR, ChinaIBRD onlyIDA & IBRD totalIDA blendIDA onlyIDA totalIndiaIndonesiaIran, Islamic Rep.IraqIsraelJamaicaJordanKazakhstanKenyaKiribatiKorea, Rep.KosovoKuwaitKyrgyz RepublicLao PDRLatin America & Caribbean Latin America & Caribbean (excluding high income)Latin America & the Caribbean (IDA & IBRD countries)Least developed countries: UN classificationLebanonLesothoLiberiaLibyaLow & middle incomeLow incomeLower middle incomeMacao SAR, ChinaMacedonia, FYRMadagascarMalawiMalaysiaMaldivesMaliMaltaMauritaniaMauritiusMexicoMiddle East & North AfricaMiddle East & North Africa (excluding high income)Middle East & North Africa (IDA & IBRD countries)Middle incomeMoldovaMongoliaMontenegroMoroccoMozambiqueNamibiaNepalNew CaledoniaNicaraguaNigerNigeriaNorth AmericaOECD membersOmanOther small statesPakistanPanamaPapua New GuineaParaguayPeruPhilippinesQatarRwandaSaudi ArabiaSenegalSerbiaSeychellesSierra LeoneSingaporeSloveniaSmall statesSolomon IslandsSouth AfricaSouth AsiaSouth Asia (IDA & IBRD)South SudanSri LankaSt. Kitts and NevisSt. LuciaSt. Vincent and the GrenadinesSub-Saharan Africa Sub-Saharan Africa (excluding high income)Sub-Saharan Africa (IDA & IBRD countries)SudanSurinameSwazilandSyrian Arab RepublicTajikistanTanzaniaThailandTimor-LesteTogoTongaTrinidad and TobagoTunisiaTurkeyTurkmenistanUgandaUkraineUpper middle incomeUruguayUzbekistanVanuatuVenezuela, RBVietnamWest Bank and GazaWorldYemen, Rep.ZambiaZimbabwe Linha do tempo:
Nesta escala de tempo está apresentado um gráfico de 1981 ano até 2015 ano Mozambique. Dados de 1980 ano ausente. O número de observações reais por data: 35.
Fonte (nome):
Indicadores de desenvolvimento mundial
Fonte (organização):
Development Assistance Committee of the Organisation for Economic Co-operation and Development, Geographical Distribution of Financial Flows to Developing Countries, Development Co-operation Report, and International Development Statistics database. Data are available online at: www.oecd.org/dac/stats/idsonline. World Bank gross capital formation estimates are used for the denominator.
Categorias:
Aid Effectiveness
Foi atualizado:
23 abr 2017 ano
Indicadores de alterações dos valores ao longo dos anos
Mínimo:
22.401
1 jan 2015 ano
Máximo:
265.577
1 jan 1993 ano
Na data de observação
Valor
Mudança absoluta
A alteração em relação ao valor anterior
1 jan 1981 ano
62.073
+62.073
0.0%
1 jan 1982 ano
41.672
-20.401
-32.87%
1 jan 1983 ano
49.693
+8.021
19.25%
1 jan 1984 ano
55.118
+5.425
10.92%
1 jan 1985 ano
64.542
+9.425
17.1%
1 jan 1986 ano
191.857
+127.315
197.26%
1 jan 1987 ano
114.011
-77.846
-40.58%
1 jan 1988 ano
166.099
+52.088
45.69%
1 jan 1989 ano
204.353
+38.255
23.03%
1 jan 1990 ano
165.607
-38.746
-18.96%
1 jan 1991 ano
179.937
+14.329
8.65%
1 jan 1992 ano
150.24
-29.697
-16.5%
1 jan 1993 ano
265.577
+115.337
76.77%
1 jan 1994 ano
197.295
-68.282
-25.71%
1 jan 1995 ano
238.662
+41.367
20.97%
1 jan 1996 ano
141.722
-96.94
-40.62%
1 jan 1997 ano
139.439
-2.283
-1.61%
1 jan 1998 ano
128.873
-10.566
-7.58%
1 jan 1999 ano
100.316
-28.558
-22.16%
1 jan 2000 ano
42.579
-57.736
-57.55%
1 jan 2001 ano
54.515
+11.935
28.03%
1 jan 2002 ano
81.504
+26.989
49.51%
1 jan 2003 ano
135.271
+53.767
65.97%
1 jan 2004 ano
72.849
-62.423
-46.15%
1 jan 2005 ano
84.429
+11.581
15.9%
1 jan 2006 ano
88.287
+3.858
4.57%
1 jan 2007 ano
109.602
+21.315
24.14%
1 jan 2008 ano
125.352
+15.75
14.37%
1 jan 2009 ano
100.674
-24.679
-19.69%
1 jan 2010 ano
125.577
+24.903
24.74%
1 jan 2011 ano
104.486
-21.091
-16.8%
1 jan 2012 ano
61.265
-43.221
-41.37%
1 jan 2013 ano
30.116
-31.149
-50.84%
1 jan 2014 ano
26.528
-3.588
-11.91%
1 jan 2015 ano
22.401
-4.128
-15.56%
Classificação de países por estatísticas atuais por anos


Comentários: