29
/pt/
pt
AIzaSyAYiBZKx7MnpbEhh9jyipgxe19OcubqV5w
April 1, 2024
214620
Norway
NOR
true
2
1
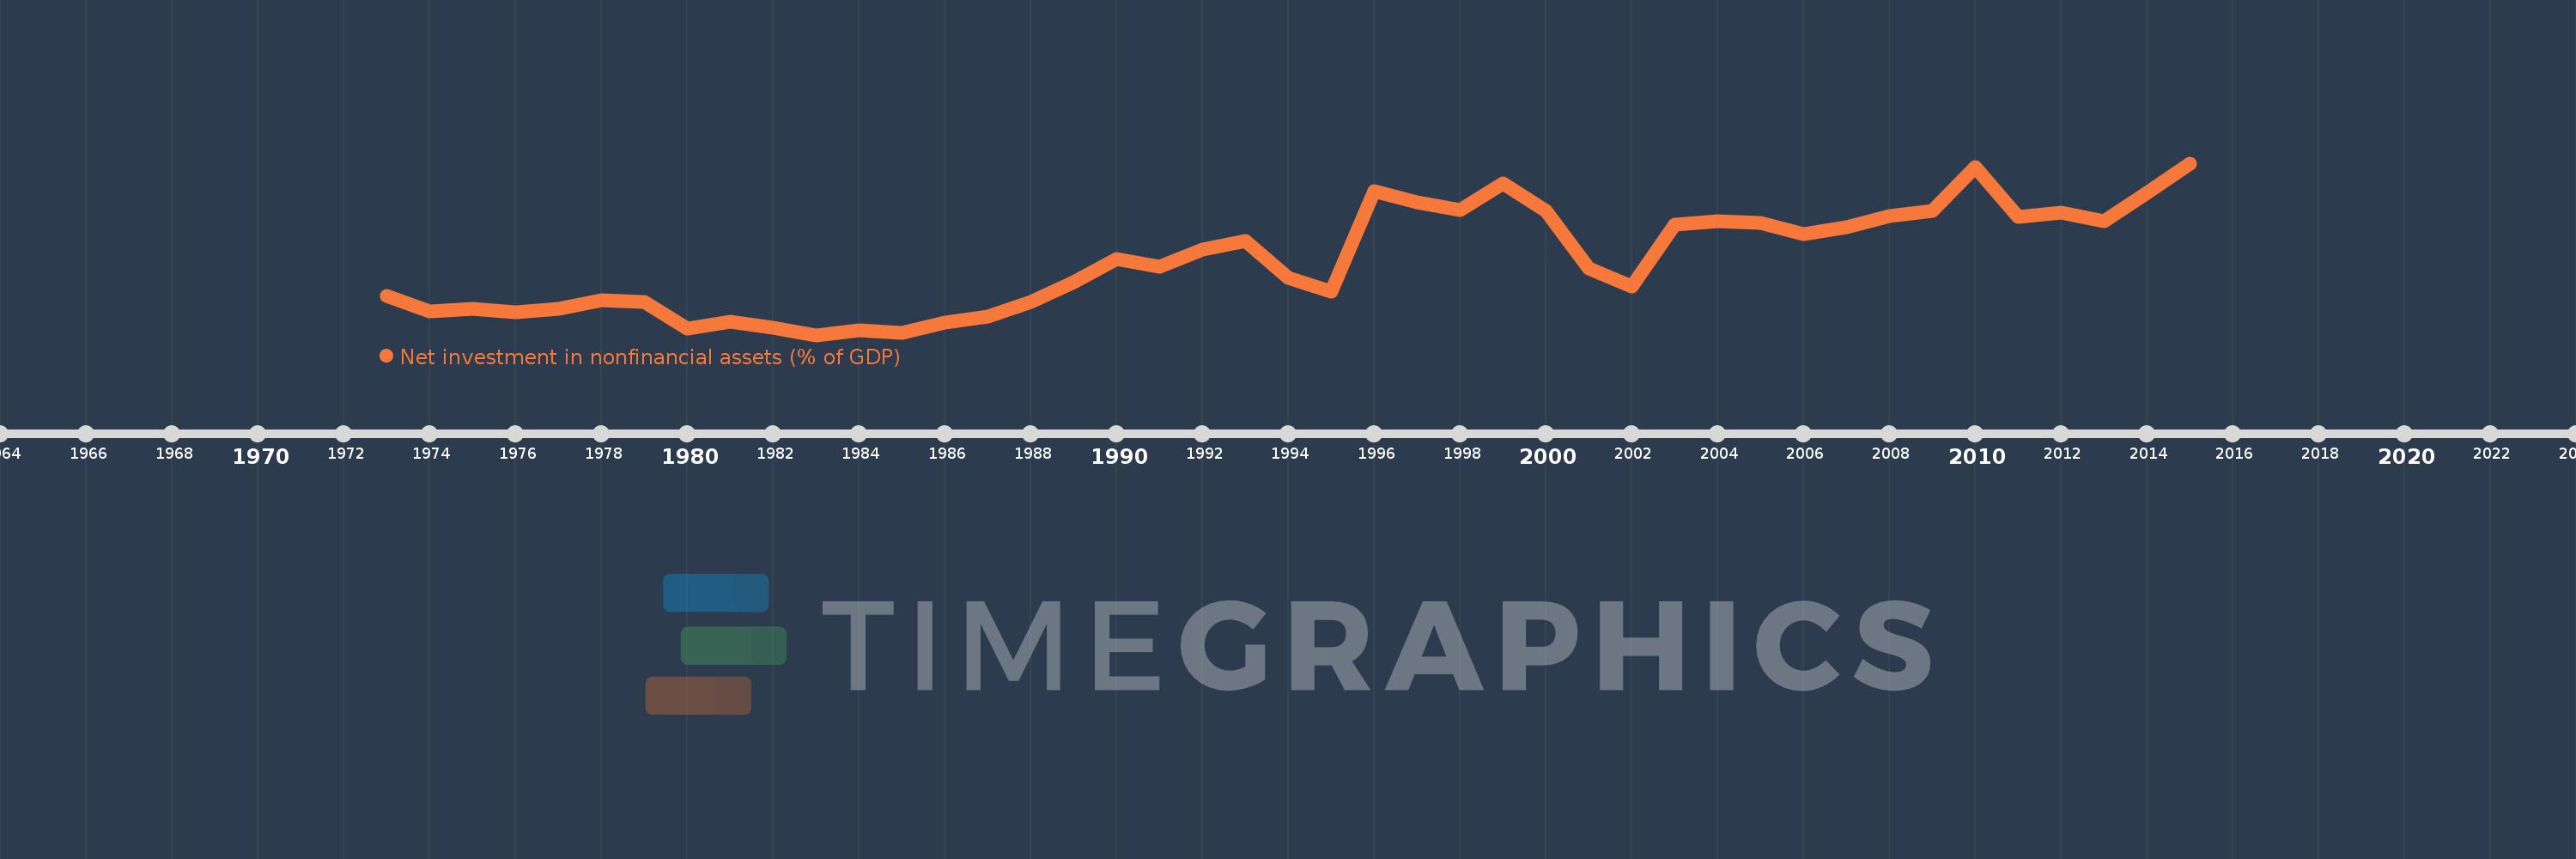
Net investment in nonfinancial assets (% of GDP)
2015,2014,2013,2012,2011,2010,2009,2008,2007,2006,2005,2004,2003,2002,2001,2000,1999,1998,1997,1996,1995,1994,1993,1992,1991,1990,1989,1988,1987,1986,1985,1984,1983,1982,1981,1980,1979,1978,1977,1976,1975,1974,1973
Estas estatísticas em outros países:
AfghanistanAlbaniaAlgeriaAngolaAntigua and BarbudaArmeniaAustraliaAustriaAzerbaijanBahamas, TheBahrainBangladeshBarbadosBelarusBelgiumBelizeBhutanBoliviaBosnia and HerzegovinaBrazilBurundiCabo VerdeCambodiaCanadaCaribbean small statesCentral African RepublicCentral Europe and the BalticsChileChinaCongo, Dem. Rep.Congo, Rep.Costa RicaCote d'IvoireCroatiaCyprusCzech RepublicDenmarkDominicaDominican RepublicEarly-demographic dividendEast Asia & Pacific (excluding high income)East Asia & Pacific (IDA & IBRD countries)Egypt, Arab Rep.El SalvadorEquatorial GuineaEstoniaEthiopiaEuro areaEurope & Central AsiaEurope & Central Asia (excluding high income)Europe & Central Asia (IDA & IBRD countries)European UnionFijiFinlandFranceGambia, TheGeorgiaGermanyGreeceGuatemalaHigh incomeHondurasHungaryIBRD onlyIcelandIDA & IBRD totalIDA blendIndiaIndonesiaIran, Islamic Rep.IraqIrelandIsraelItalyJamaicaKazakhstanKiribatiKorea, Rep.Kyrgyz RepublicLao PDRLate-demographic dividendLatin America & Caribbean Latin America & Caribbean (excluding high income)Latin America & the Caribbean (IDA & IBRD countries)LatviaLebanonLithuaniaLow & middle incomeLower middle incomeLuxembourgMacao SAR, ChinaMacedonia, FYRMadagascarMalawiMaldivesMaliMaltaMauritiusMexicoMicronesia, Fed. Sts.Middle East & North Africa (excluding high income)Middle East & North Africa (IDA & IBRD countries)Middle incomeMoldovaMongoliaMoroccoMozambiqueNamibiaNepalNetherlandsNew ZealandNicaraguaNigeriaNorth AmericaNorwayOECD membersOmanOther small statesPacific island small statesPakistanParaguayPeruPhilippinesPolandPortugalPost-demographic dividendQatarRomaniaRussian FederationRwandaSamoaSan MarinoSao Tome and PrincipeSenegalSerbiaSierra LeoneSingaporeSlovak RepublicSmall statesSolomon IslandsSouth AfricaSouth AsiaSouth Asia (IDA & IBRD)SpainSri LankaSub-Saharan Africa Sub-Saharan Africa (excluding high income)Sub-Saharan Africa (IDA & IBRD countries)SurinameSwazilandSwedenSwitzerlandSyrian Arab RepublicThailandTimor-LesteTrinidad and TobagoTurkeyUgandaUkraineUnited Arab EmiratesUnited KingdomUnited StatesUpper middle incomeUruguayVanuatuVietnamWest Bank and GazaWorldYemen, Rep.Zimbabwe Linha do tempo:
Nesta escala de tempo está apresentado um gráfico de 1973 ano até 2015 ano Norway. Dados de 1972 ano ausente. O número de observações reais por data: 43.
Fonte (nome):
Indicadores de desenvolvimento mundial
Fonte (organização):
International Monetary Fund, Government Finance Statistics Yearbook and data files.
Categorias:
Public Sector
Foi atualizado:
23 abr 2017 ano
Indicadores de alterações dos valores ao longo dos anos
Mínimo:
1.111
1 jan 1983 ano
Máximo:
2.701
1 jan 2015 ano
Na data de observação
Valor
Mudança absoluta
A alteração em relação ao valor anterior
1 jan 1973 ano
1.476
+1.476
0.0%
1 jan 1974 ano
1.327
-0.149
-10.1%
1 jan 1975 ano
1.355
+0.028
2.14%
1 jan 1976 ano
1.323
-0.032
-2.36%
1 jan 1977 ano
1.354
+0.031
2.34%
1 jan 1978 ano
1.431
+0.077
5.7%
1 jan 1979 ano
1.42
-0.012
-0.83%
1 jan 1980 ano
1.169
-0.25
-17.63%
1 jan 1981 ano
1.235
+0.066
5.61%
1 jan 1982 ano
1.179
-0.056
-4.51%
1 jan 1983 ano
1.111
-0.068
-5.74%
1 jan 1984 ano
1.152
+0.04
3.62%
1 jan 1985 ano
1.128
-0.024
-2.1%
1 jan 1986 ano
1.229
+0.101
8.96%
1 jan 1987 ano
1.285
+0.056
4.58%
1 jan 1988 ano
1.419
+0.135
10.47%
1 jan 1989 ano
1.597
+0.177
12.48%
1 jan 1990 ano
1.817
+0.22
13.79%
1 jan 1991 ano
1.74
-0.077
-4.22%
1 jan 1992 ano
1.905
+0.165
9.49%
1 jan 1993 ano
1.985
+0.079
4.17%
1 jan 1994 ano
1.64
-0.344
-17.35%
1 jan 1995 ano
1.516
-0.125
-7.6%
1 jan 1996 ano
2.439
+0.923
60.92%
1 jan 1997 ano
2.343
-0.096
-3.92%
1 jan 1998 ano
2.271
-0.073
-3.1%
1 jan 1999 ano
2.517
+0.246
10.83%
1 jan 2000 ano
2.256
-0.261
-10.37%
1 jan 2001 ano
1.73
-0.526
-23.32%
1 jan 2002 ano
1.563
-0.166
-9.61%
1 jan 2003 ano
2.129
+0.566
36.21%
1 jan 2004 ano
2.166
+0.036
1.69%
1 jan 2005 ano
2.151
-0.015
-0.67%
1 jan 2006 ano
2.047
-0.104
-4.84%
1 jan 2007 ano
2.11
+0.063
3.08%
1 jan 2008 ano
2.209
+0.099
4.71%
1 jan 2009 ano
2.263
+0.054
2.43%
1 jan 2010 ano
2.667
+0.404
17.85%
1 jan 2011 ano
2.207
-0.46
-17.25%
1 jan 2012 ano
2.24
+0.034
1.52%
1 jan 2013 ano
2.168
-0.073
-3.24%
1 jan 2014 ano
2.427
+0.259
11.94%
1 jan 2015 ano
2.701
+0.275
11.32%
Classificação de países por estatísticas atuais por anos


Comentários: