29
/pt/
pt
AIzaSyAYiBZKx7MnpbEhh9jyipgxe19OcubqV5w
April 1, 2024
139577
Germany
DEU
true
2
1
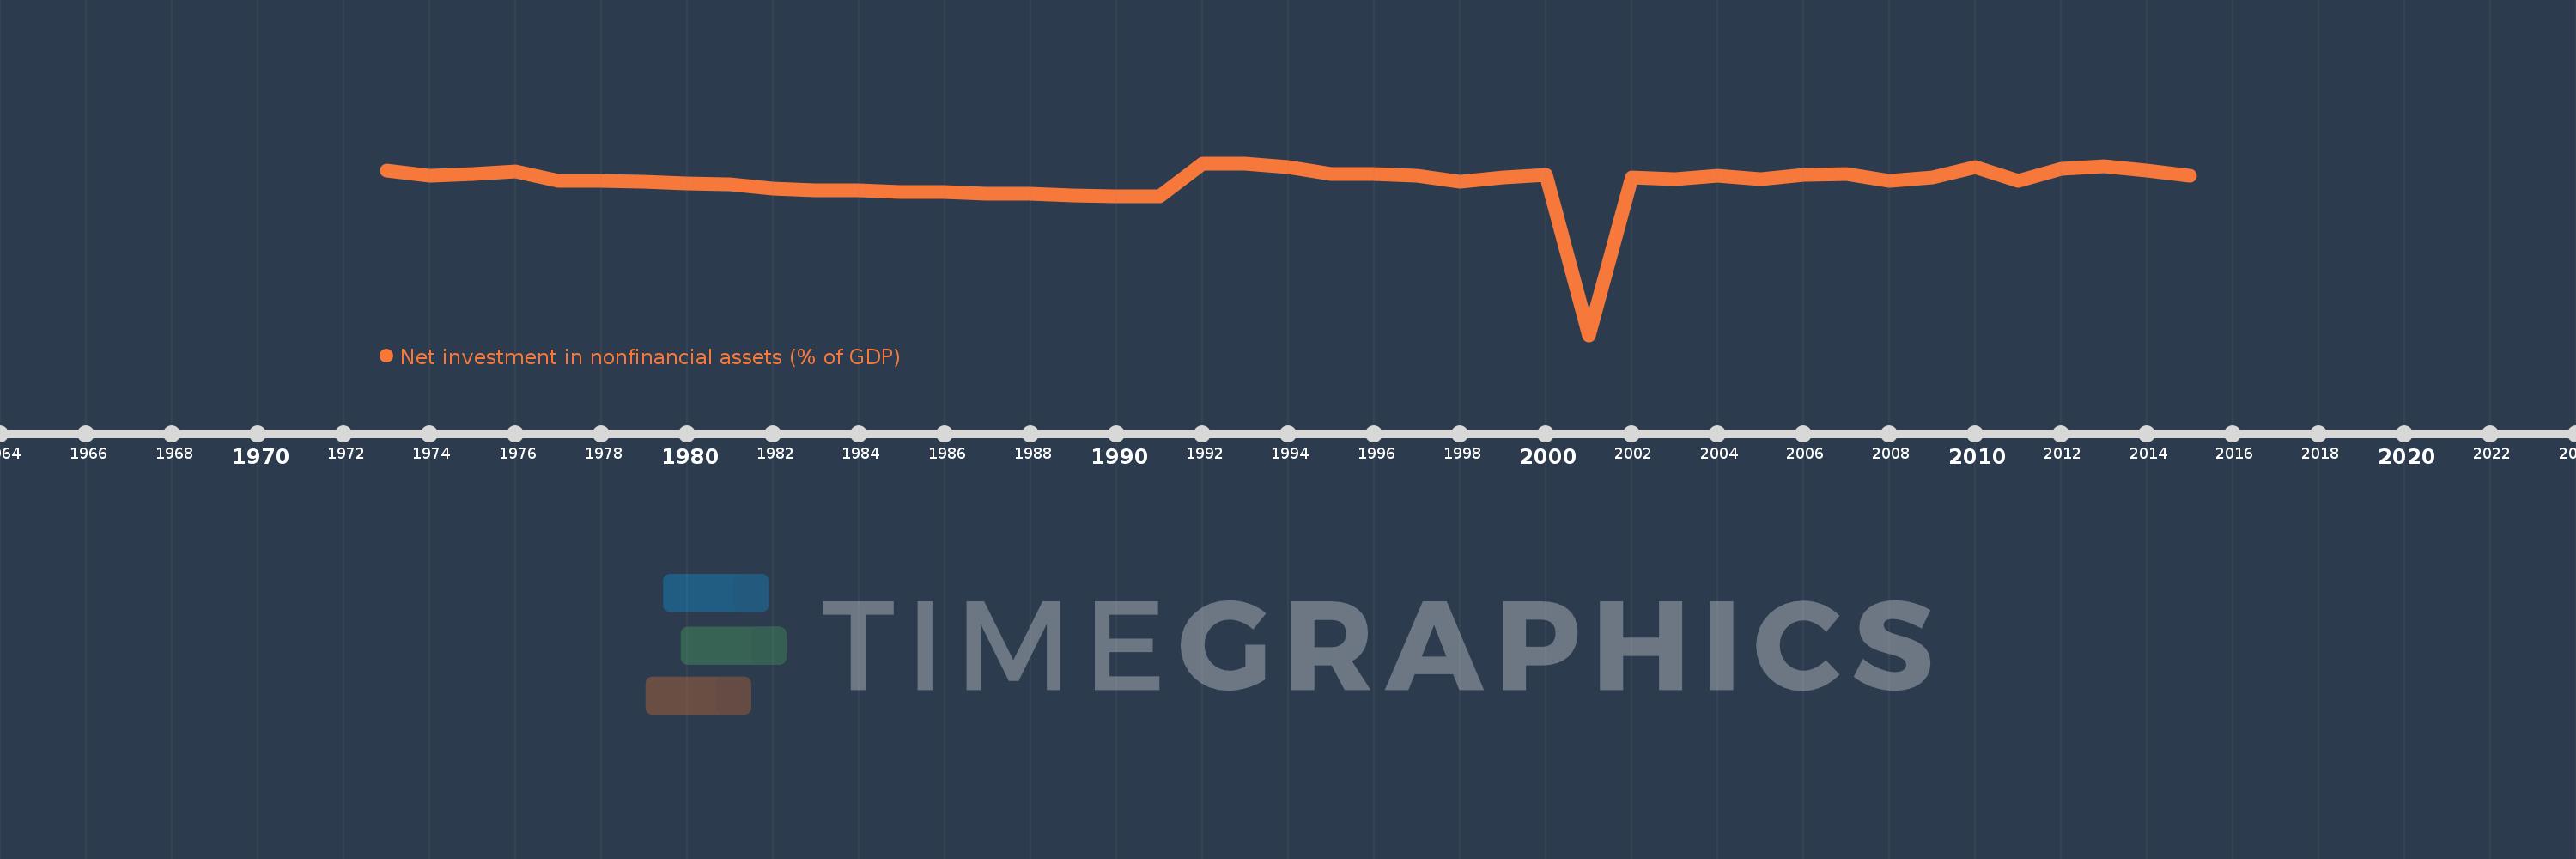
Net investment in nonfinancial assets (% of GDP)
2015,2014,2013,2012,2011,2010,2009,2008,2007,2006,2005,2004,2003,2002,2001,2000,1999,1998,1997,1996,1995,1994,1993,1992,1991,1990,1989,1988,1987,1986,1985,1984,1983,1982,1981,1980,1979,1978,1977,1976,1975,1974,1973
Estas estatísticas em outros países:
AfghanistanAlbaniaAlgeriaAngolaAntigua and BarbudaArmeniaAustraliaAustriaAzerbaijanBahamas, TheBahrainBangladeshBarbadosBelarusBelgiumBelizeBhutanBoliviaBosnia and HerzegovinaBrazilBurundiCabo VerdeCambodiaCanadaCaribbean small statesCentral African RepublicCentral Europe and the BalticsChileChinaCongo, Dem. Rep.Congo, Rep.Costa RicaCote d'IvoireCroatiaCyprusCzech RepublicDenmarkDominicaDominican RepublicEarly-demographic dividendEast Asia & Pacific (excluding high income)East Asia & Pacific (IDA & IBRD countries)Egypt, Arab Rep.El SalvadorEquatorial GuineaEstoniaEthiopiaEuro areaEurope & Central AsiaEurope & Central Asia (excluding high income)Europe & Central Asia (IDA & IBRD countries)European UnionFijiFinlandFranceGambia, TheGeorgiaGermanyGreeceGuatemalaHigh incomeHondurasHungaryIBRD onlyIcelandIDA & IBRD totalIDA blendIndiaIndonesiaIran, Islamic Rep.IraqIrelandIsraelItalyJamaicaKazakhstanKiribatiKorea, Rep.Kyrgyz RepublicLao PDRLate-demographic dividendLatin America & Caribbean Latin America & Caribbean (excluding high income)Latin America & the Caribbean (IDA & IBRD countries)LatviaLebanonLithuaniaLow & middle incomeLower middle incomeLuxembourgMacao SAR, ChinaMacedonia, FYRMadagascarMalawiMaldivesMaliMaltaMauritiusMexicoMicronesia, Fed. Sts.Middle East & North Africa (excluding high income)Middle East & North Africa (IDA & IBRD countries)Middle incomeMoldovaMongoliaMoroccoMozambiqueNamibiaNepalNetherlandsNew ZealandNicaraguaNigeriaNorth AmericaNorwayOECD membersOmanOther small statesPacific island small statesPakistanParaguayPeruPhilippinesPolandPortugalPost-demographic dividendQatarRomaniaRussian FederationRwandaSamoaSan MarinoSao Tome and PrincipeSenegalSerbiaSierra LeoneSingaporeSlovak RepublicSmall statesSolomon IslandsSouth AfricaSouth AsiaSouth Asia (IDA & IBRD)SpainSri LankaSub-Saharan Africa Sub-Saharan Africa (excluding high income)Sub-Saharan Africa (IDA & IBRD countries)SurinameSwazilandSwedenSwitzerlandSyrian Arab RepublicThailandTimor-LesteTrinidad and TobagoTurkeyUgandaUkraineUnited Arab EmiratesUnited KingdomUnited StatesUpper middle incomeUruguayVanuatuVietnamWest Bank and GazaWorldYemen, Rep.Zimbabwe Linha do tempo:
Nesta escala de tempo está apresentado um gráfico de 1973 ano até 2015 ano Germany. Dados de 1972 ano ausente. O número de observações reais por data: 43.
Fonte (nome):
Indicadores de desenvolvimento mundial
Fonte (organização):
International Monetary Fund, Government Finance Statistics Yearbook and data files.
Categorias:
Public Sector
Foi atualizado:
23 abr 2017 ano
Indicadores de alterações dos valores ao longo dos anos
Mínimo:
-1.776
1 jan 2001 ano
Máximo:
0.835
1 jan 1992 ano
Na data de observação
Valor
Mudança absoluta
A alteração em relação ao valor anterior
1 jan 1973 ano
0.725
+0.725
0.0%
1 jan 1974 ano
0.643
-0.082
-11.26%
1 jan 1975 ano
0.675
+0.032
5.0%
1 jan 1976 ano
0.709
+0.033
4.95%
1 jan 1977 ano
0.564
-0.145
-20.43%
1 jan 1978 ano
0.569
+0.006
1.0%
1 jan 1979 ano
0.551
-0.018
-3.16%
1 jan 1980 ano
0.528
-0.024
-4.32%
1 jan 1981 ano
0.518
-0.01
-1.86%
1 jan 1982 ano
0.446
-0.072
-13.94%
1 jan 1983 ano
0.427
-0.019
-4.24%
1 jan 1984 ano
0.424
-0.002
-0.53%
1 jan 1985 ano
0.4
-0.024
-5.67%
1 jan 1986 ano
0.404
+0.003
0.81%
1 jan 1987 ano
0.378
-0.025
-6.29%
1 jan 1988 ano
0.37
-0.008
-2.17%
1 jan 1989 ano
0.344
-0.026
-7.05%
1 jan 1990 ano
0.332
-0.012
-3.56%
1 jan 1991 ano
0.329
-0.003
-0.82%
1 jan 1992 ano
0.835
+0.506
153.92%
1 jan 1993 ano
0.828
-0.007
-0.83%
1 jan 1994 ano
0.773
-0.056
-6.71%
1 jan 1995 ano
0.666
-0.107
-13.86%
1 jan 1996 ano
0.672
+0.006
0.92%
1 jan 1997 ano
0.64
-0.032
-4.78%
1 jan 1998 ano
0.551
-0.089
-13.94%
1 jan 1999 ano
0.615
+0.064
11.67%
1 jan 2000 ano
0.662
+0.047
7.71%
1 jan 2001 ano
-1.776
-2.438
-368.15%
1 jan 2002 ano
0.619
+2.395
-134.87%
1 jan 2003 ano
0.592
-0.027
-4.41%
1 jan 2004 ano
0.652
+0.06
10.19%
1 jan 2005 ano
0.587
-0.065
-9.97%
1 jan 2006 ano
0.66
+0.073
12.43%
1 jan 2007 ano
0.674
+0.014
2.05%
1 jan 2008 ano
0.563
-0.111
-16.43%
1 jan 2009 ano
0.616
+0.053
9.36%
1 jan 2010 ano
0.771
+0.155
25.17%
1 jan 2011 ano
0.567
-0.204
-26.42%
1 jan 2012 ano
0.744
+0.177
31.19%
1 jan 2013 ano
0.79
+0.046
6.25%
1 jan 2014 ano
0.723
-0.067
-8.51%
1 jan 2015 ano
0.641
-0.082
-11.35%
Classificação de países por estatísticas atuais por anos


Comentários: