29
/pt/
pt
AIzaSyAYiBZKx7MnpbEhh9jyipgxe19OcubqV5w
April 1, 2024
201319
Morocco
MAR
true
2
1
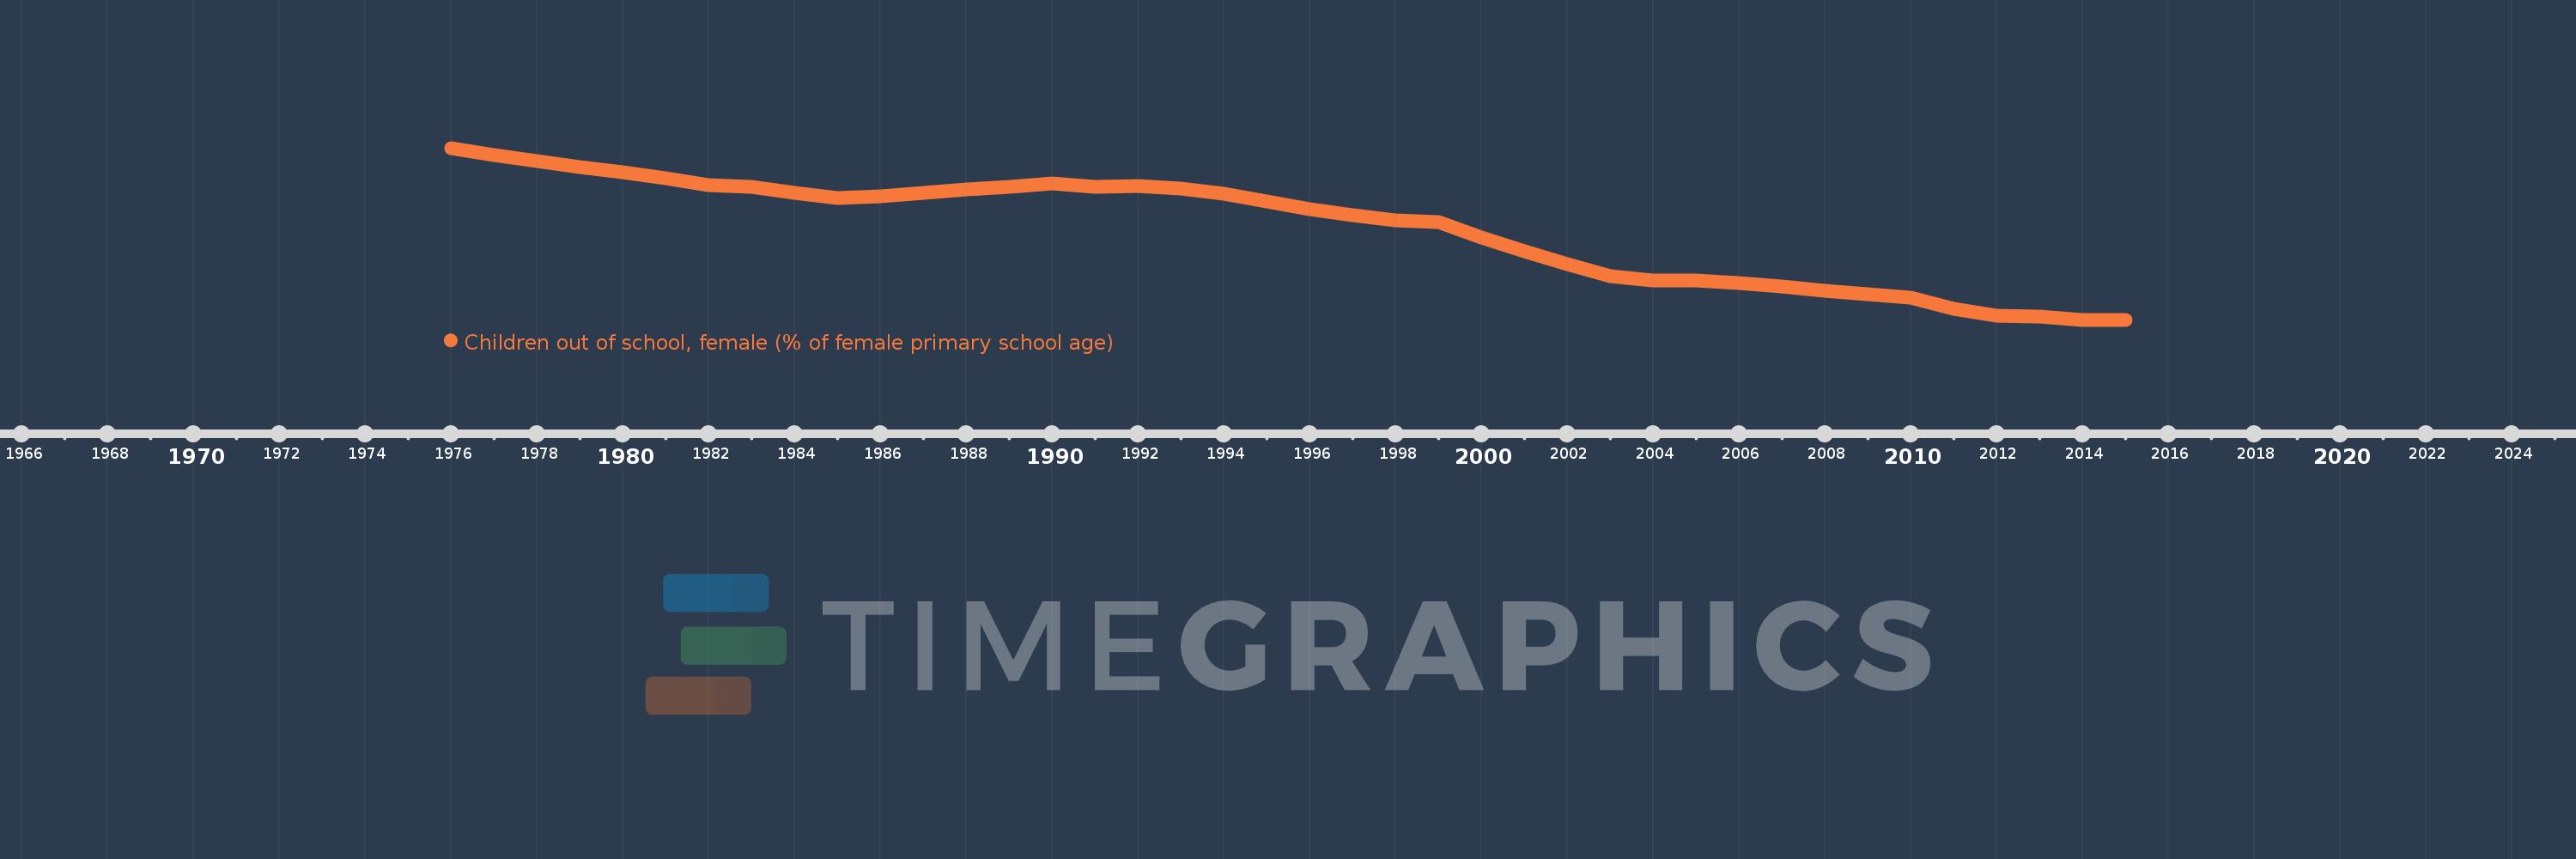
Children out of school, female (% of female primary school age)
2015,2014,2013,2012,2011,2010,2009,2008,2007,2006,2005,2004,2003,2002,2001,2000,1999,1998,1997,1996,1995,1994,1993,1992,1991,1990,1989,1988,1987,1986,1985,1984,1983,1982,1981,1980,1979,1978,1977,1976
Estas estatísticas em outros países:
AfghanistanAlbaniaAlgeriaAngolaAntigua and BarbudaArab WorldArgentinaArmeniaArubaAustraliaAustriaAzerbaijanBahamas, TheBahrainBangladeshBarbadosBelarusBelgiumBelizeBeninBermudaBhutanBoliviaBosnia and HerzegovinaBotswanaBrazilBrunei DarussalamBulgariaBurkina FasoBurundiCabo VerdeCambodiaCameroonCanadaCaribbean small statesCentral African RepublicCentral Europe and the BalticsChadChileChinaColombiaComorosCongo, Dem. Rep.Congo, Rep.Costa RicaCote d'IvoireCroatiaCubaCyprusDenmarkDjiboutiDominicaDominican RepublicEarly-demographic dividendEast Asia & PacificEast Asia & Pacific (excluding high income)East Asia & Pacific (IDA & IBRD countries)EcuadorEgypt, Arab Rep.El SalvadorEquatorial GuineaEritreaEstoniaEthiopiaEuro areaEurope & Central AsiaEurope & Central Asia (excluding high income)Europe & Central Asia (IDA & IBRD countries)European UnionFijiFinlandFragile and conflict affected situationsFranceGabonGambia, TheGeorgiaGhanaGreeceGrenadaGuatemalaGuineaGuinea-BissauGuyanaHaitiHeavily indebted poor countries (HIPC)High incomeHondurasHong Kong SAR, ChinaHungaryIBRD onlyIcelandIDA & IBRD totalIDA blendIDA onlyIDA totalIndiaIndonesiaIran, Islamic Rep.IraqIrelandIsraelItalyJamaicaJapanJordanKazakhstanKenyaKiribatiKorea, Dem. People’s Rep.Korea, Rep.KuwaitKyrgyz RepublicLao PDRLate-demographic dividendLatin America & Caribbean Latin America & Caribbean (excluding high income)Latin America & the Caribbean (IDA & IBRD countries)LatviaLeast developed countries: UN classificationLebanonLesothoLiberiaLibyaLiechtensteinLithuaniaLow & middle incomeLow incomeLower middle incomeLuxembourgMacao SAR, ChinaMacedonia, FYRMadagascarMalawiMaldivesMaliMaltaMarshall IslandsMauritaniaMauritiusMexicoMicronesia, Fed. Sts.Middle East & North AfricaMiddle East & North Africa (excluding high income)Middle East & North Africa (IDA & IBRD countries)Middle incomeMoldovaMongoliaMontenegroMoroccoMozambiqueMyanmarNamibiaNauruNepalNetherlandsNew ZealandNicaraguaNigerNigeriaNorth AmericaNorwayOECD membersOmanOther small statesPacific island small statesPakistanPanamaPapua New GuineaParaguayPeruPhilippinesPolandPortugalPost-demographic dividendPre-demographic dividendPuerto RicoQatarRomaniaRussian FederationRwandaSamoaSan MarinoSao Tome and PrincipeSaudi ArabiaSenegalSerbiaSeychellesSierra LeoneSloveniaSmall statesSolomon IslandsSomaliaSouth AfricaSouth AsiaSouth Asia (IDA & IBRD)South SudanSpainSri LankaSt. Kitts and NevisSt. LuciaSt. Vincent and the GrenadinesSub-Saharan Africa Sub-Saharan Africa (excluding high income)Sub-Saharan Africa (IDA & IBRD countries)SudanSurinameSwazilandSwedenSwitzerlandSyrian Arab RepublicTajikistanTanzaniaThailandTimor-LesteTogoTongaTrinidad and TobagoTunisiaTurkeyTuvaluUgandaUkraineUnited Arab EmiratesUnited KingdomUnited StatesUpper middle incomeUruguayUzbekistanVanuatuVenezuela, RBWest Bank and GazaWorldYemen, Rep.ZambiaZimbabwe Linha do tempo:
Nesta escala de tempo está apresentado um gráfico de 1976 ano até 2015 ano Morocco. Dados de 1975 ano ausente. O número de observações reais por data: 40.
Fonte (nome):
Indicadores de desenvolvimento mundial
Fonte (organização):
United Nations Educational, Scientific, and Cultural Organization (UNESCO) Institute for Statistics.
Categorias:
Education
Foi atualizado:
23 abr 2017 ano
Indicadores de alterações dos valores ao longo dos anos
Mínimo:
1.193
1 jan 2015 ano
Máximo:
69.77
1 jan 1976 ano
Na data de observação
Valor
Mudança absoluta
A alteração em relação ao valor anterior
1 jan 1976 ano
69.77
+69.77
0.0%
1 jan 1977 ano
66.855
-2.915
-4.18%
1 jan 1978 ano
64.647
-2.209
-3.3%
1 jan 1979 ano
62.056
-2.591
-4.01%
1 jan 1980 ano
59.929
-2.127
-3.43%
1 jan 1981 ano
57.611
-2.318
-3.87%
1 jan 1982 ano
55.053
-2.558
-4.44%
1 jan 1983 ano
54.197
-0.856
-1.55%
1 jan 1984 ano
51.795
-2.403
-4.43%
1 jan 1985 ano
49.652
-2.143
-4.14%
1 jan 1986 ano
50.477
+0.825
1.66%
1 jan 1987 ano
51.763
+1.285
2.55%
1 jan 1988 ano
53.147
+1.384
2.67%
1 jan 1989 ano
54.211
+1.064
2.0%
1 jan 1990 ano
55.582
+1.371
2.53%
1 jan 1991 ano
54.353
-1.229
-2.21%
1 jan 1992 ano
54.423
+0.069
0.13%
1 jan 1993 ano
53.54
-0.883
-1.62%
1 jan 1994 ano
51.346
-2.194
-4.1%
1 jan 1995 ano
48.466
-2.88
-5.61%
1 jan 1996 ano
45.453
-3.013
-6.22%
1 jan 1997 ano
42.882
-2.571
-5.66%
1 jan 1998 ano
41.026
-1.857
-4.33%
1 jan 1999 ano
40.163
-0.863
-2.1%
1 jan 2000 ano
34.133
-6.03
-15.01%
1 jan 2001 ano
28.468
-5.665
-16.6%
1 jan 2002 ano
23.507
-4.961
-17.43%
1 jan 2003 ano
18.677
-4.83
-20.55%
1 jan 2004 ano
16.938
-1.739
-9.31%
1 jan 2005 ano
16.877
-0.061
-0.36%
1 jan 2006 ano
15.816
-1.061
-6.29%
1 jan 2007 ano
14.348
-1.468
-9.28%
1 jan 2008 ano
12.657
-1.692
-11.79%
1 jan 2009 ano
11.251
-1.405
-11.1%
1 jan 2010 ano
10.143
-1.108
-9.85%
1 jan 2011 ano
5.664
-4.479
-44.16%
1 jan 2012 ano
2.935
-2.729
-48.19%
1 jan 2013 ano
2.303
-0.631
-21.51%
1 jan 2014 ano
1.196
-1.107
-48.06%
1 jan 2015 ano
1.193
-0.003
-0.26%
Classificação de países por estatísticas atuais por anos


Comentários: