29
/pt/
pt
AIzaSyAYiBZKx7MnpbEhh9jyipgxe19OcubqV5w
April 1, 2024
193962
Mauritius
MUS
true
2
1
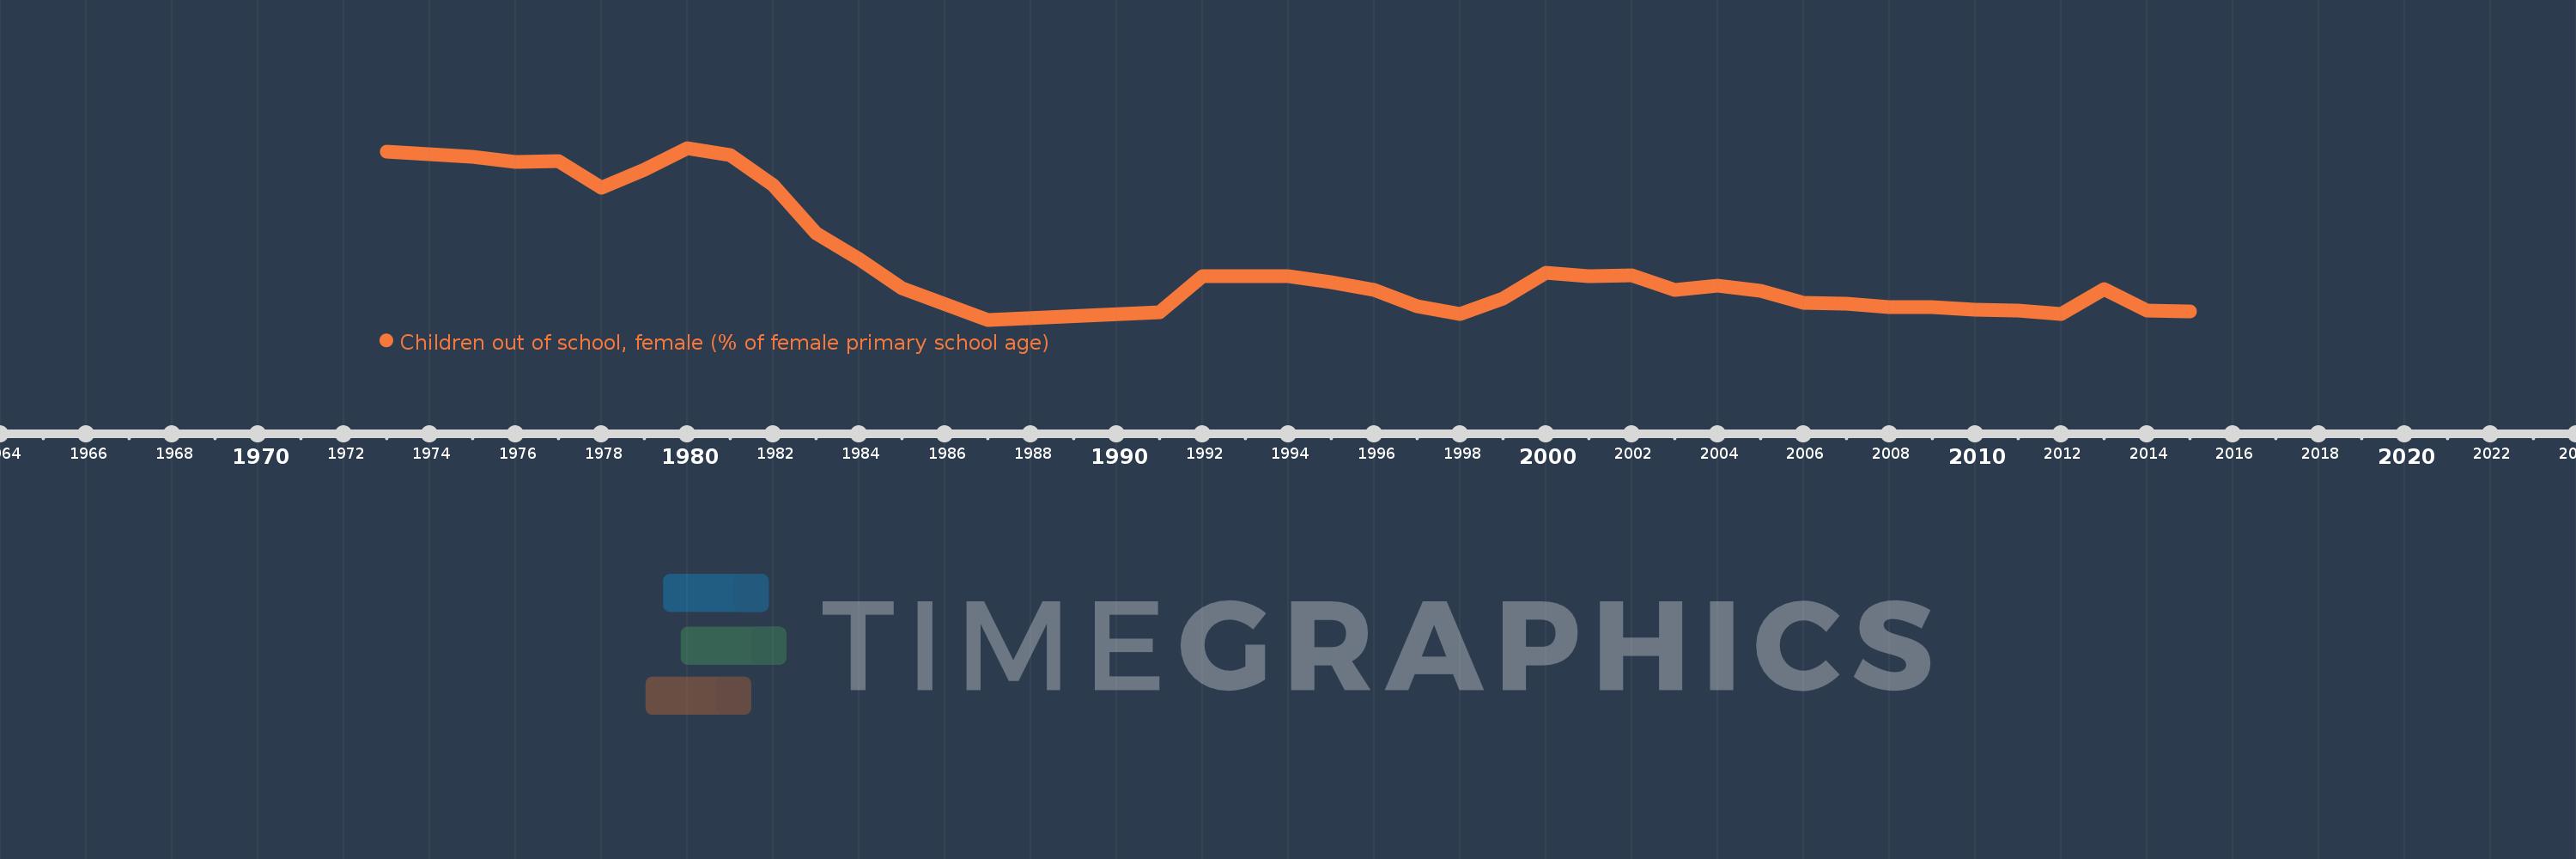
Children out of school, female (% of female primary school age)
2015,2014,2013,2012,2011,2010,2009,2008,2007,2006,2005,2004,2003,2002,2001,2000,1999,1998,1997,1996,1995,1994,1992,1991,1987,1985,1984,1983,1982,1981,1980,1979,1978,1977,1976,1975,1974,1973
Estas estatísticas em outros países:
AfghanistanAlbaniaAlgeriaAngolaAntigua and BarbudaArab WorldArgentinaArmeniaArubaAustraliaAustriaAzerbaijanBahamas, TheBahrainBangladeshBarbadosBelarusBelgiumBelizeBeninBermudaBhutanBoliviaBosnia and HerzegovinaBotswanaBrazilBrunei DarussalamBulgariaBurkina FasoBurundiCabo VerdeCambodiaCameroonCanadaCaribbean small statesCentral African RepublicCentral Europe and the BalticsChadChileChinaColombiaComorosCongo, Dem. Rep.Congo, Rep.Costa RicaCote d'IvoireCroatiaCubaCyprusDenmarkDjiboutiDominicaDominican RepublicEarly-demographic dividendEast Asia & PacificEast Asia & Pacific (excluding high income)East Asia & Pacific (IDA & IBRD countries)EcuadorEgypt, Arab Rep.El SalvadorEquatorial GuineaEritreaEstoniaEthiopiaEuro areaEurope & Central AsiaEurope & Central Asia (excluding high income)Europe & Central Asia (IDA & IBRD countries)European UnionFijiFinlandFragile and conflict affected situationsFranceGabonGambia, TheGeorgiaGhanaGreeceGrenadaGuatemalaGuineaGuinea-BissauGuyanaHaitiHeavily indebted poor countries (HIPC)High incomeHondurasHong Kong SAR, ChinaHungaryIBRD onlyIcelandIDA & IBRD totalIDA blendIDA onlyIDA totalIndiaIndonesiaIran, Islamic Rep.IraqIrelandIsraelItalyJamaicaJapanJordanKazakhstanKenyaKiribatiKorea, Dem. People’s Rep.Korea, Rep.KuwaitKyrgyz RepublicLao PDRLate-demographic dividendLatin America & Caribbean Latin America & Caribbean (excluding high income)Latin America & the Caribbean (IDA & IBRD countries)LatviaLeast developed countries: UN classificationLebanonLesothoLiberiaLibyaLiechtensteinLithuaniaLow & middle incomeLow incomeLower middle incomeLuxembourgMacao SAR, ChinaMacedonia, FYRMadagascarMalawiMaldivesMaliMaltaMarshall IslandsMauritaniaMauritiusMexicoMicronesia, Fed. Sts.Middle East & North AfricaMiddle East & North Africa (excluding high income)Middle East & North Africa (IDA & IBRD countries)Middle incomeMoldovaMongoliaMontenegroMoroccoMozambiqueMyanmarNamibiaNauruNepalNetherlandsNew ZealandNicaraguaNigerNigeriaNorth AmericaNorwayOECD membersOmanOther small statesPacific island small statesPakistanPanamaPapua New GuineaParaguayPeruPhilippinesPolandPortugalPost-demographic dividendPre-demographic dividendPuerto RicoQatarRomaniaRussian FederationRwandaSamoaSan MarinoSao Tome and PrincipeSaudi ArabiaSenegalSerbiaSeychellesSierra LeoneSloveniaSmall statesSolomon IslandsSomaliaSouth AfricaSouth AsiaSouth Asia (IDA & IBRD)South SudanSpainSri LankaSt. Kitts and NevisSt. LuciaSt. Vincent and the GrenadinesSub-Saharan Africa Sub-Saharan Africa (excluding high income)Sub-Saharan Africa (IDA & IBRD countries)SudanSurinameSwazilandSwedenSwitzerlandSyrian Arab RepublicTajikistanTanzaniaThailandTimor-LesteTogoTongaTrinidad and TobagoTunisiaTurkeyTuvaluUgandaUkraineUnited Arab EmiratesUnited KingdomUnited StatesUpper middle incomeUruguayUzbekistanVanuatuVenezuela, RBWest Bank and GazaWorldYemen, Rep.ZambiaZimbabwe Linha do tempo:
Nesta escala de tempo está apresentado um gráfico de 1973 ano até 2015 ano Mauritius. Dados de 1972 ano ausente. O número de observações reais por data: 38.
Fonte (nome):
Indicadores de desenvolvimento mundial
Fonte (organização):
United Nations Educational, Scientific, and Cultural Organization (UNESCO) Institute for Statistics.
Categorias:
Education
Foi atualizado:
23 abr 2017 ano
Indicadores de alterações dos valores ao longo dos anos
Mínimo:
1.337
1 jan 1987 ano
Máximo:
22.278
1 jan 1980 ano
Na data de observação
Valor
Mudança absoluta
A alteração em relação ao valor anterior
1 jan 1973 ano
21.839
+21.839
0.0%
1 jan 1974 ano
21.482
-0.357
-1.63%
1 jan 1975 ano
21.215
-0.267
-1.25%
1 jan 1976 ano
20.539
-0.676
-3.19%
1 jan 1977 ano
20.698
+0.159
0.77%
1 jan 1978 ano
17.445
-3.253
-15.72%
1 jan 1979 ano
19.657
+2.212
12.68%
1 jan 1980 ano
22.278
+2.621
13.33%
1 jan 1981 ano
21.427
-0.85
-3.82%
1 jan 1982 ano
17.723
-3.705
-17.29%
1 jan 1983 ano
11.893
-5.829
-32.89%
1 jan 1984 ano
8.755
-3.138
-26.39%
1 jan 1985 ano
5.165
-3.59
-41.0%
1 jan 1987 ano
1.337
-3.829
-74.12%
1 jan 1991 ano
2.202
+0.865
64.72%
1 jan 1992 ano
6.667
+4.466
202.84%
1 jan 1994 ano
6.625
-0.042
-0.64%
1 jan 1995 ano
5.895
-0.729
-11.01%
1 jan 1996 ano
4.964
-0.931
-15.8%
1 jan 1997 ano
2.942
-2.022
-40.73%
1 jan 1998 ano
2.04
-0.902
-30.67%
1 jan 1999 ano
3.933
+1.893
92.78%
1 jan 2000 ano
7.017
+3.084
78.42%
1 jan 2001 ano
6.635
-0.381
-5.44%
1 jan 2002 ano
6.77
+0.135
2.03%
1 jan 2003 ano
5.022
-1.748
-25.82%
1 jan 2004 ano
5.465
+0.443
8.82%
1 jan 2005 ano
4.915
-0.55
-10.07%
1 jan 2006 ano
3.419
-1.496
-30.44%
1 jan 2007 ano
3.291
-0.128
-3.73%
1 jan 2008 ano
2.854
-0.437
-13.28%
1 jan 2009 ano
2.909
+0.055
1.94%
1 jan 2010 ano
2.579
-0.331
-11.37%
1 jan 2011 ano
2.43
-0.148
-5.75%
1 jan 2012 ano
2.062
-0.368
-15.15%
1 jan 2013 ano
5.05
+2.987
144.88%
1 jan 2014 ano
2.497
-2.552
-50.55%
1 jan 2015 ano
2.386
-0.111
-4.45%
Classificação de países por estatísticas atuais por anos


Comentários: