29
/pt/
pt
AIzaSyAYiBZKx7MnpbEhh9jyipgxe19OcubqV5w
April 1, 2024
195164
Mexico
MEX
true
2
1
Agriculture, value added (annual % growth)
2016,2015,2014,2013,2012,2011,2010,2009,2008,2007,2006,2005,2004,2003,2002,2001,2000,1999,1998,1997,1996,1995,1994,1993,1992,1991,1990,1989,1988,1987,1986,1985,1984,1983,1982,1981,1980,1979,1978,1977,1976,1975,1974,1973,1972,1971,1970,1969,1968,1967
Estas estatísticas em outros países:
AfghanistanAlbaniaAlgeriaAntigua and BarbudaArab WorldArgentinaArmeniaAustraliaAustriaAzerbaijanBahamas, TheBahrainBangladeshBelarusBelgiumBelizeBeninBermudaBhutanBoliviaBosnia and HerzegovinaBotswanaBrazilBrunei DarussalamBulgariaBurkina FasoBurundiCabo VerdeCambodiaCameroonCanadaCaribbean small statesCayman IslandsCentral African RepublicCentral Europe and the BalticsChadChileChinaColombiaComorosCongo, Dem. Rep.Congo, Rep.Costa RicaCote d'IvoireCroatiaCubaCyprusCzech RepublicDenmarkDjiboutiDominicaDominican RepublicEarly-demographic dividendEast Asia & PacificEast Asia & Pacific (excluding high income)East Asia & Pacific (IDA & IBRD countries)EcuadorEgypt, Arab Rep.El SalvadorEquatorial GuineaEritreaEstoniaEthiopiaEuro areaEurope & Central AsiaEurope & Central Asia (excluding high income)Europe & Central Asia (IDA & IBRD countries)European UnionFijiFinlandFragile and conflict affected situationsFranceGabonGambia, TheGeorgiaGermanyGhanaGreeceGrenadaGuatemalaGuineaGuinea-BissauGuyanaHaitiHeavily indebted poor countries (HIPC)High incomeHondurasHong Kong SAR, ChinaHungaryIBRD onlyIcelandIDA & IBRD totalIDA blendIDA onlyIDA totalIndiaIndonesiaIran, Islamic Rep.IraqIrelandItalyJamaicaJapanJordanKazakhstanKenyaKiribatiKorea, Rep.KosovoKuwaitKyrgyz RepublicLao PDRLate-demographic dividendLatin America & Caribbean Latin America & Caribbean (excluding high income)Latin America & the Caribbean (IDA & IBRD countries)LatviaLeast developed countries: UN classificationLebanonLesothoLiberiaLithuaniaLow & middle incomeLow incomeLower middle incomeLuxembourgMacedonia, FYRMadagascarMalawiMalaysiaMaldivesMaliMarshall IslandsMauritaniaMauritiusMexicoMicronesia, Fed. Sts.Middle East & North AfricaMiddle East & North Africa (excluding high income)Middle East & North Africa (IDA & IBRD countries)Middle incomeMoldovaMongoliaMontenegroMoroccoMozambiqueMyanmarNamibiaNepalNetherlandsNew ZealandNicaraguaNigerNigeriaNorth AmericaNorwayOECD membersOmanOther small statesPakistanPalauPanamaPapua New GuineaParaguayPeruPhilippinesPolandPortugalPost-demographic dividendPre-demographic dividendPuerto RicoQatarRomaniaRussian FederationRwandaSamoaSao Tome and PrincipeSaudi ArabiaSenegalSerbiaSeychellesSierra LeoneSingaporeSlovak RepublicSloveniaSmall statesSolomon IslandsSomaliaSouth AfricaSouth AsiaSouth Asia (IDA & IBRD)SpainSri LankaSt. Kitts and NevisSt. LuciaSt. Vincent and the GrenadinesSub-Saharan Africa Sub-Saharan Africa (excluding high income)Sub-Saharan Africa (IDA & IBRD countries)SudanSurinameSwazilandSwedenSwitzerlandSyrian Arab RepublicTajikistanTanzaniaThailandTimor-LesteTogoTongaTrinidad and TobagoTunisiaTurkeyTurkmenistanTuvaluUgandaUkraineUnited Arab EmiratesUnited KingdomUnited StatesUpper middle incomeUruguayUzbekistanVanuatuVenezuela, RBVietnamWest Bank and GazaWorldZambiaZimbabwe Linha do tempo:
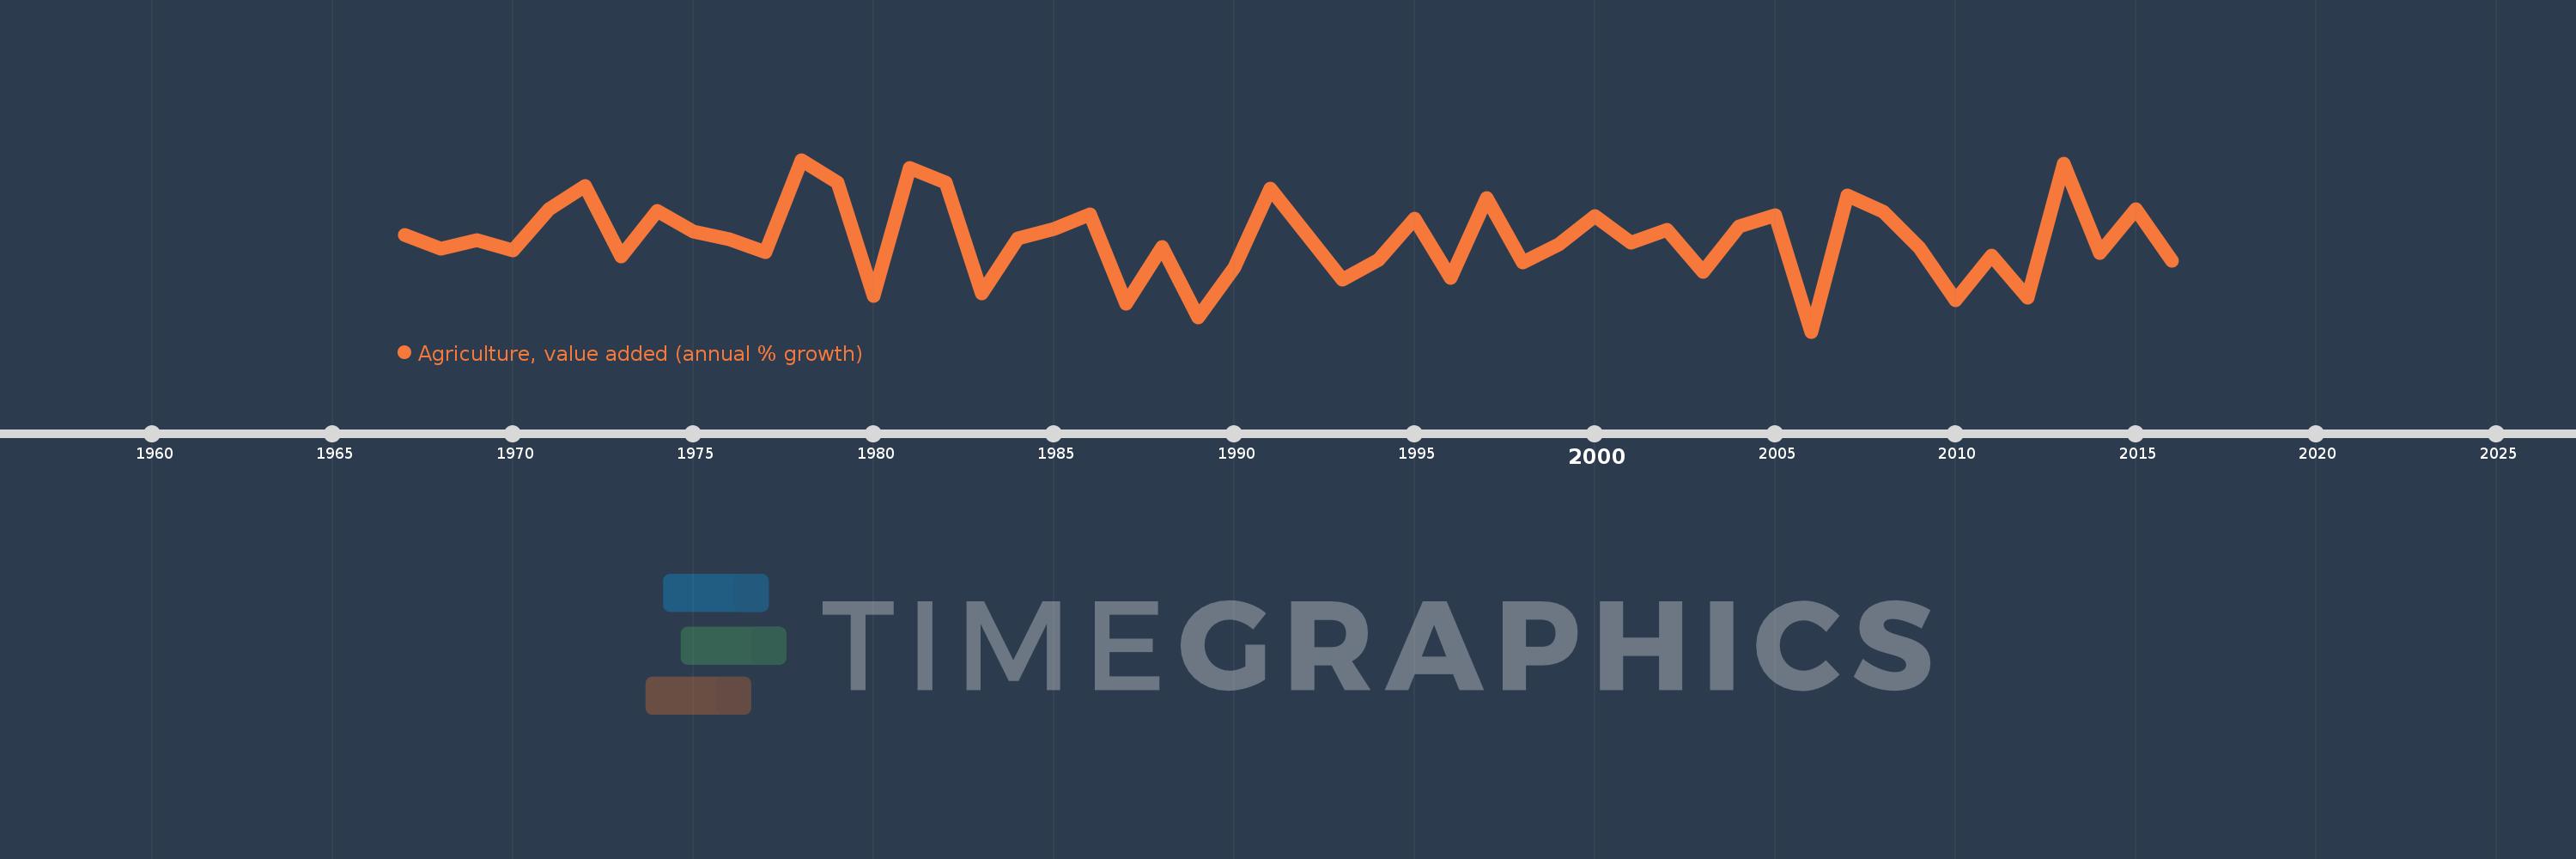
Nesta escala de tempo está apresentado um gráfico de 1967 ano até 2016 ano Mexico. Dados de 1966 ano ausente. O número de observações reais por data: 50.
Fonte (nome):
Indicadores de desenvolvimento mundial
Fonte (organização):
World Bank national accounts data, and OECD National Accounts data files.
Categorias:
Economy & Growth
Foi atualizado:
23 abr 2017 ano
Indicadores de alterações dos valores ao longo dos anos
Mínimo:
-4.78
1 jan 2006 ano
Máximo:
7.746
1 jan 1978 ano
Na data de observação
Valor
Mudança absoluta
A alteração em relação ao valor anterior
1 jan 1967 ano
2.283
+2.283
0.0%
1 jan 1968 ano
1.266
-1.017
-44.53%
1 jan 1969 ano
1.877
+0.611
48.24%
1 jan 1970 ano
1.135
-0.742
-39.55%
1 jan 1971 ano
4.161
+3.026
266.67%
1 jan 1972 ano
5.825
+1.664
39.99%
1 jan 1973 ano
0.688
-5.137
-88.18%
1 jan 1974 ano
4.013
+3.325
483.07%
1 jan 1975 ano
2.508
-1.505
-37.51%
1 jan 1976 ano
1.95
-0.557
-22.22%
1 jan 1977 ano
1.024
-0.927
-47.51%
1 jan 1978 ano
7.746
+6.722
656.53%
1 jan 1979 ano
6.055
-1.69
-21.83%
1 jan 1980 ano
-2.162
-8.218
-135.71%
1 jan 1981 ano
7.175
+9.337
-431.8%
1 jan 1982 ano
6.116
-1.059
-14.76%
1 jan 1983 ano
-1.968
-8.084
-132.18%
1 jan 1984 ano
2.02
+3.988
-202.62%
1 jan 1985 ano
2.692
+0.672
33.28%
1 jan 1986 ano
3.75
+1.058
39.31%
1 jan 1987 ano
-2.721
-6.471
-172.54%
1 jan 1988 ano
1.374
+4.095
-150.52%
1 jan 1989 ano
-3.776
-5.15
-374.73%
1 jan 1990 ano
-0.134
+3.642
-96.45%
1 jan 1991 ano
5.634
+5.768
-4.3 mil%
1 jan 1992 ano
2.325
-3.309
-58.74%
1 jan 1993 ano
-0.967
-3.292
-141.6%
1 jan 1994 ano
0.479
+1.446
-149.5%
1 jan 1995 ano
3.45
+2.971
620.74%
1 jan 1996 ano
-0.876
-4.326
-125.4%
1 jan 1997 ano
4.978
+5.854
-668.03%
1 jan 1998 ano
0.281
-4.697
-94.36%
1 jan 1999 ano
1.583
+1.302
463.83%
1 jan 2000 ano
3.632
+2.049
129.41%
1 jan 2001 ano
1.691
-1.941
-53.43%
1 jan 2002 ano
2.614
+0.922
54.52%
1 jan 2003 ano
-0.396
-3.01
-115.16%
1 jan 2004 ano
2.885
+3.281
-828.12%
1 jan 2005 ano
3.735
+0.85
29.48%
1 jan 2006 ano
-4.78
-8.516
-227.96%
1 jan 2007 ano
5.132
+9.912
-207.35%
1 jan 2008 ano
3.978
-1.154
-22.49%
1 jan 2009 ano
1.315
-2.662
-66.94%
1 jan 2010 ano
-2.5
-3.815
-290.09%
1 jan 2011 ano
0.756
+3.256
-130.24%
1 jan 2012 ano
-2.296
-3.052
-403.69%
1 jan 2013 ano
7.439
+9.735
-424.05%
1 jan 2014 ano
0.949
-6.49
-87.24%
1 jan 2015 ano
4.175
+3.226
339.82%
1 jan 2016 ano
0.387
-3.788
-90.72%
Classificação de países por estatísticas atuais por anos


Comentários: