29
/pt/
pt
AIzaSyAYiBZKx7MnpbEhh9jyipgxe19OcubqV5w
April 1, 2024
116623
Cyprus
CYP
true
2
1
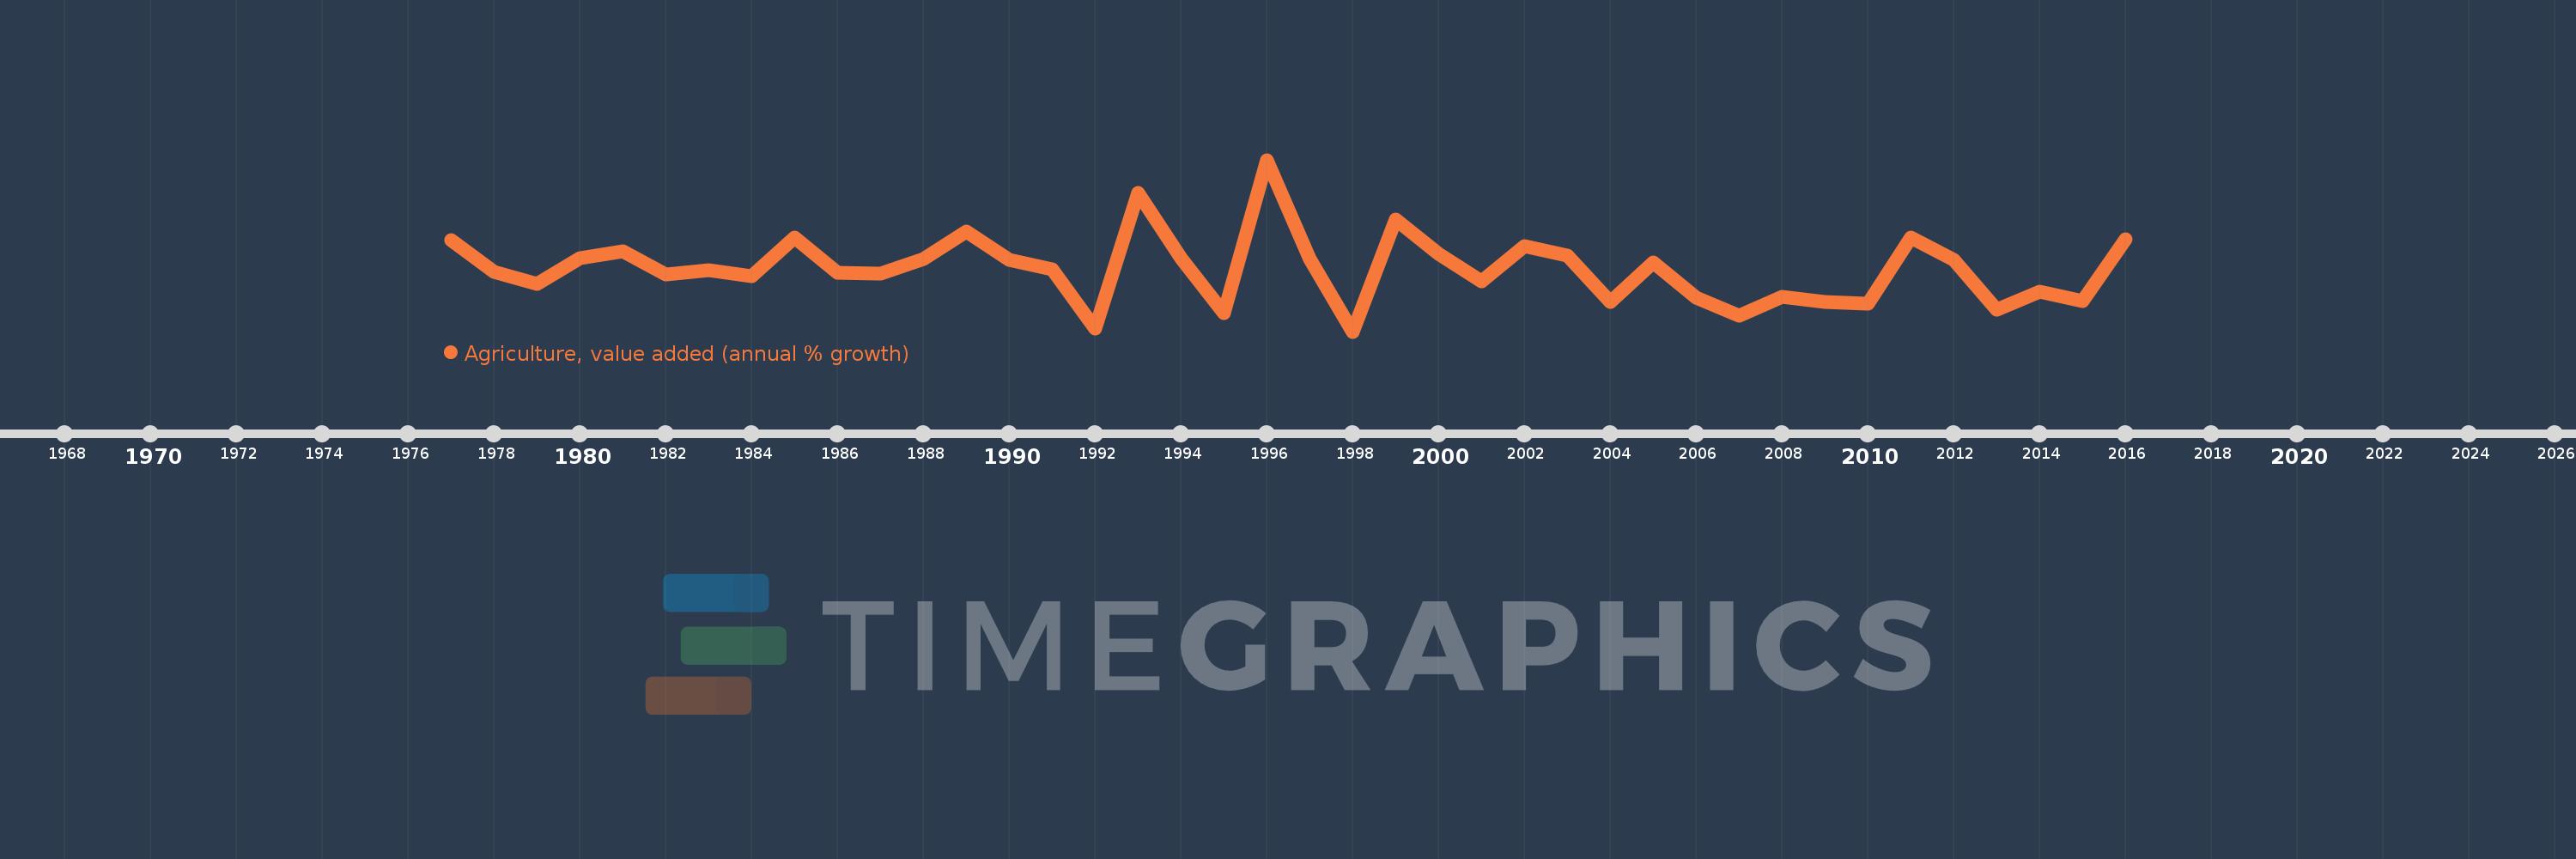
Agriculture, value added (annual % growth)
2016,2015,2014,2013,2012,2011,2010,2009,2008,2007,2006,2005,2004,2003,2002,2001,2000,1999,1998,1997,1996,1995,1994,1993,1992,1991,1990,1989,1988,1987,1986,1985,1984,1983,1982,1981,1980,1979,1978,1977
Estas estatísticas em outros países:
AfghanistanAlbaniaAlgeriaAntigua and BarbudaArab WorldArgentinaArmeniaAustraliaAustriaAzerbaijanBahamas, TheBahrainBangladeshBelarusBelgiumBelizeBeninBermudaBhutanBoliviaBosnia and HerzegovinaBotswanaBrazilBrunei DarussalamBulgariaBurkina FasoBurundiCabo VerdeCambodiaCameroonCanadaCaribbean small statesCayman IslandsCentral African RepublicCentral Europe and the BalticsChadChileChinaColombiaComorosCongo, Dem. Rep.Congo, Rep.Costa RicaCote d'IvoireCroatiaCubaCyprusCzech RepublicDenmarkDjiboutiDominicaDominican RepublicEarly-demographic dividendEast Asia & PacificEast Asia & Pacific (excluding high income)East Asia & Pacific (IDA & IBRD countries)EcuadorEgypt, Arab Rep.El SalvadorEquatorial GuineaEritreaEstoniaEthiopiaEuro areaEurope & Central AsiaEurope & Central Asia (excluding high income)Europe & Central Asia (IDA & IBRD countries)European UnionFijiFinlandFragile and conflict affected situationsFranceGabonGambia, TheGeorgiaGermanyGhanaGreeceGrenadaGuatemalaGuineaGuinea-BissauGuyanaHaitiHeavily indebted poor countries (HIPC)High incomeHondurasHong Kong SAR, ChinaHungaryIBRD onlyIcelandIDA & IBRD totalIDA blendIDA onlyIDA totalIndiaIndonesiaIran, Islamic Rep.IraqIrelandItalyJamaicaJapanJordanKazakhstanKenyaKiribatiKorea, Rep.KosovoKuwaitKyrgyz RepublicLao PDRLate-demographic dividendLatin America & Caribbean Latin America & Caribbean (excluding high income)Latin America & the Caribbean (IDA & IBRD countries)LatviaLeast developed countries: UN classificationLebanonLesothoLiberiaLithuaniaLow & middle incomeLow incomeLower middle incomeLuxembourgMacedonia, FYRMadagascarMalawiMalaysiaMaldivesMaliMarshall IslandsMauritaniaMauritiusMexicoMicronesia, Fed. Sts.Middle East & North AfricaMiddle East & North Africa (excluding high income)Middle East & North Africa (IDA & IBRD countries)Middle incomeMoldovaMongoliaMontenegroMoroccoMozambiqueMyanmarNamibiaNepalNetherlandsNew ZealandNicaraguaNigerNigeriaNorth AmericaNorwayOECD membersOmanOther small statesPakistanPalauPanamaPapua New GuineaParaguayPeruPhilippinesPolandPortugalPost-demographic dividendPre-demographic dividendPuerto RicoQatarRomaniaRussian FederationRwandaSamoaSao Tome and PrincipeSaudi ArabiaSenegalSerbiaSeychellesSierra LeoneSingaporeSlovak RepublicSloveniaSmall statesSolomon IslandsSomaliaSouth AfricaSouth AsiaSouth Asia (IDA & IBRD)SpainSri LankaSt. Kitts and NevisSt. LuciaSt. Vincent and the GrenadinesSub-Saharan Africa Sub-Saharan Africa (excluding high income)Sub-Saharan Africa (IDA & IBRD countries)SudanSurinameSwazilandSwedenSwitzerlandSyrian Arab RepublicTajikistanTanzaniaThailandTimor-LesteTogoTongaTrinidad and TobagoTunisiaTurkeyTurkmenistanTuvaluUgandaUkraineUnited Arab EmiratesUnited KingdomUnited StatesUpper middle incomeUruguayUzbekistanVanuatuVenezuela, RBVietnamWest Bank and GazaWorldZambiaZimbabwe Linha do tempo:
Nesta escala de tempo está apresentado um gráfico de 1977 ano até 2016 ano Cyprus. Dados de 1976 ano ausente. O número de observações reais por data: 40.
Fonte (nome):
Indicadores de desenvolvimento mundial
Fonte (organização):
World Bank national accounts data, and OECD National Accounts data files.
Categorias:
Economy & Growth
Foi atualizado:
23 abr 2017 ano
Indicadores de alterações dos valores ao longo dos anos
Mínimo:
-15.988
1 jan 1998 ano
Máximo:
30.107
1 jan 1996 ano
Na data de observação
Valor
Mudança absoluta
A alteração em relação ao valor anterior
1 jan 1977 ano
8.463
+8.463
0.0%
1 jan 1978 ano
0.103
-8.361
-98.79%
1 jan 1979 ano
-3.282
-3.385
-3.3 mil%
1 jan 1980 ano
3.606
+6.888
-209.86%
1 jan 1981 ano
5.629
+2.024
56.13%
1 jan 1982 ano
-0.678
-6.308
-112.05%
1 jan 1983 ano
0.39
+1.068
-157.53%
1 jan 1984 ano
-1.069
-1.459
-373.95%
1 jan 1985 ano
9.332
+10.401
-972.95%
1 jan 1986 ano
-0.27
-9.602
-102.89%
1 jan 1987 ano
-0.541
-0.271
100.54%
1 jan 1988 ano
3.442
+3.983
-736.79%
1 jan 1989 ano
10.946
+7.504
218.0%
1 jan 1990 ano
3.315
-7.631
-69.71%
1 jan 1991 ano
0.764
-2.551
-76.95%
1 jan 1992 ano
-15.087
-15.851
-2.07 mil%
1 jan 1993 ano
21.339
+36.426
-241.44%
1 jan 1994 ano
3.753
-17.587
-82.41%
1 jan 1995 ano
-10.922
-14.675
-391.04%
1 jan 1996 ano
30.107
+41.029
-375.65%
1 jan 1997 ano
3.467
-26.639
-88.48%
1 jan 1998 ano
-15.988
-19.455
-561.1%
1 jan 1999 ano
14.017
+30.005
-187.67%
1 jan 2000 ano
4.835
-9.182
-65.51%
1 jan 2001 ano
-2.41
-7.245
-149.85%
1 jan 2002 ano
6.91
+9.321
-386.72%
1 jan 2003 ano
4.331
-2.579
-37.32%
1 jan 2004 ano
-8.112
-12.443
-287.27%
1 jan 2005 ano
2.572
+10.683
-131.71%
1 jan 2006 ano
-6.957
-9.529
-370.52%
1 jan 2007 ano
-11.823
-4.866
69.94%
1 jan 2008 ano
-6.553
+5.27
-44.58%
1 jan 2009 ano
-8.044
-1.491
22.75%
1 jan 2010 ano
-8.555
-0.511
6.36%
1 jan 2011 ano
9.145
+17.7
-206.9%
1 jan 2012 ano
3.307
-5.838
-63.84%
1 jan 2013 ano
-10.224
-13.53
-409.19%
1 jan 2014 ano
-5.365
+4.859
-47.52%
1 jan 2015 ano
-7.901
-2.535
47.26%
1 jan 2016 ano
8.817
+16.717
-211.59%
Classificação de países por estatísticas atuais por anos


Comentários: