29
/pt/
pt
AIzaSyAYiBZKx7MnpbEhh9jyipgxe19OcubqV5w
April 1, 2024
191348
Malta
MLT
true
2
1
Exports of goods and services (% of GDP)
2016,2015,2014,2013,2012,2011,2010,2009,2008,2007,2006,2005,2004,2003,2002,2001,2000,1999,1998,1997,1996,1995,1994,1993,1992,1991,1990,1989,1988,1987,1986,1985,1984,1983,1982,1981,1980,1979,1978,1977,1976,1975,1974,1973,1972,1971
Estas estatísticas em outros países:
AfghanistanAlbaniaAlgeriaAngolaAntigua and BarbudaArab WorldArgentinaArmeniaArubaAustraliaAustriaAzerbaijanBahamas, TheBahrainBangladeshBarbadosBelarusBelgiumBelizeBeninBermudaBhutanBoliviaBosnia and HerzegovinaBotswanaBrazilBrunei DarussalamBulgariaBurkina FasoBurundiCabo VerdeCambodiaCameroonCanadaCaribbean small statesCentral African RepublicCentral Europe and the BalticsChadChileChinaColombiaComorosCongo, Dem. Rep.Congo, Rep.Costa RicaCote d'IvoireCroatiaCubaCyprusCzech RepublicDenmarkDjiboutiDominicaDominican RepublicEarly-demographic dividendEast Asia & PacificEast Asia & Pacific (excluding high income)East Asia & Pacific (IDA & IBRD countries)EcuadorEgypt, Arab Rep.El SalvadorEquatorial GuineaEritreaEstoniaEthiopiaEuro areaEurope & Central AsiaEurope & Central Asia (excluding high income)Europe & Central Asia (IDA & IBRD countries)European UnionFaroe IslandsFijiFinlandFragile and conflict affected situationsFranceFrench PolynesiaGabonGambia, TheGeorgiaGermanyGhanaGreeceGrenadaGuatemalaGuineaGuinea-BissauGuyanaHaitiHeavily indebted poor countries (HIPC)High incomeHondurasHong Kong SAR, ChinaHungaryIBRD onlyIcelandIDA & IBRD totalIDA blendIDA onlyIDA totalIndiaIndonesiaIran, Islamic Rep.IraqIrelandIsraelItalyJamaicaJapanJordanKazakhstanKenyaKiribatiKorea, Rep.KosovoKuwaitKyrgyz RepublicLao PDRLate-demographic dividendLatin America & Caribbean Latin America & Caribbean (excluding high income)Latin America & the Caribbean (IDA & IBRD countries)LatviaLeast developed countries: UN classificationLebanonLesothoLiberiaLibyaLithuaniaLow & middle incomeLow incomeLower middle incomeLuxembourgMacao SAR, ChinaMacedonia, FYRMadagascarMalawiMalaysiaMaldivesMaliMaltaMauritaniaMauritiusMexicoMicronesia, Fed. Sts.Middle East & North AfricaMiddle East & North Africa (excluding high income)Middle East & North Africa (IDA & IBRD countries)Middle incomeMoldovaMongoliaMontenegroMoroccoMozambiqueMyanmarNamibiaNepalNetherlandsNew CaledoniaNew ZealandNicaraguaNigerNigeriaNorth AmericaNorwayOECD membersOmanOther small statesPacific island small statesPakistanPalauPanamaPapua New GuineaParaguayPeruPhilippinesPolandPortugalPost-demographic dividendPre-demographic dividendPuerto RicoQatarRomaniaRussian FederationRwandaSamoaSaudi ArabiaSenegalSerbiaSeychellesSierra LeoneSingaporeSlovak RepublicSloveniaSmall statesSolomon IslandsSomaliaSouth AfricaSouth AsiaSouth Asia (IDA & IBRD)South SudanSpainSri LankaSt. Kitts and NevisSt. LuciaSt. Vincent and the GrenadinesSub-Saharan Africa Sub-Saharan Africa (excluding high income)Sub-Saharan Africa (IDA & IBRD countries)SudanSurinameSwazilandSwedenSwitzerlandSyrian Arab RepublicTajikistanTanzaniaThailandTimor-LesteTogoTongaTrinidad and TobagoTunisiaTurkeyTurkmenistanUgandaUkraineUnited Arab EmiratesUnited KingdomUnited StatesUpper middle incomeUruguayUzbekistanVanuatuVenezuela, RBVietnamWest Bank and GazaWorldYemen, Rep.ZambiaZimbabwe Linha do tempo:
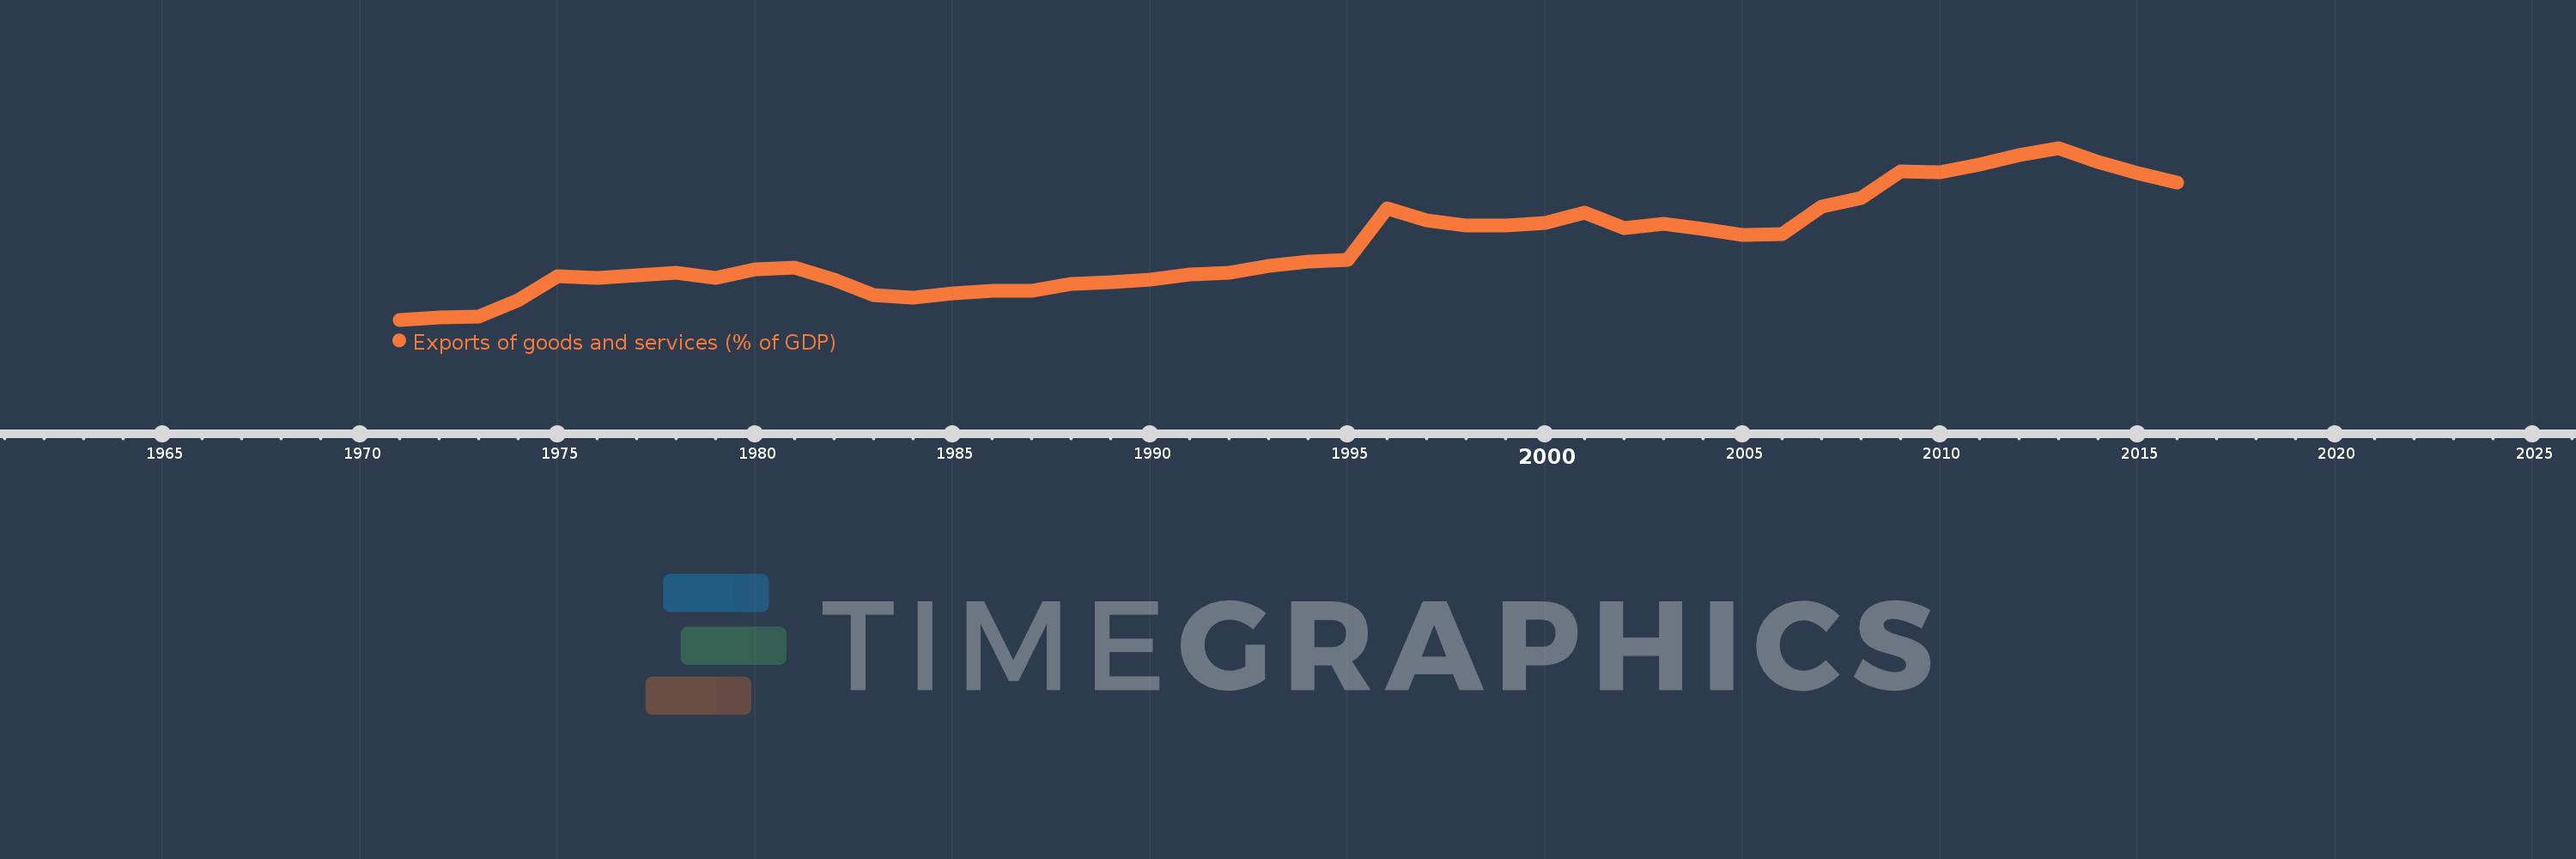
Nesta escala de tempo está apresentado um gráfico de 1971 ano até 2016 ano Malta. Dados de 1970 ano ausente. O número de observações reais por data: 46.
Fonte (nome):
Indicadores de desenvolvimento mundial
Fonte (organização):
World Bank national accounts data, and OECD National Accounts data files.
Categorias:
Economy & Growth, Trade
Foi atualizado:
23 abr 2017 ano
Indicadores de alterações dos valores ao longo dos anos
Mínimo:
44.181
1 jan 1971 ano
Máximo:
164.81
1 jan 2013 ano
Na data de observação
Valor
Mudança absoluta
A alteração em relação ao valor anterior
1 jan 1971 ano
44.181
+44.181
0.0%
1 jan 1972 ano
45.511
+1.33
3.01%
1 jan 1973 ano
46.526
+1.015
2.23%
1 jan 1974 ano
57.898
+11.372
24.44%
1 jan 1975 ano
74.641
+16.744
28.92%
1 jan 1976 ano
73.692
-0.949
-1.27%
1 jan 1977 ano
75.414
+1.722
2.34%
1 jan 1978 ano
76.924
+1.51
2.0%
1 jan 1979 ano
73.554
-3.37
-4.38%
1 jan 1980 ano
79.389
+5.836
7.93%
1 jan 1981 ano
80.934
+1.544
1.95%
1 jan 1982 ano
72.536
-8.398
-10.38%
1 jan 1983 ano
61.599
-10.937
-15.08%
1 jan 1984 ano
59.806
-1.793
-2.91%
1 jan 1985 ano
62.418
+2.612
4.37%
1 jan 1986 ano
64.5
+2.082
3.33%
1 jan 1987 ano
64.335
-0.165
-0.26%
1 jan 1988 ano
69.58
+5.245
8.15%
1 jan 1989 ano
70.405
+0.825
1.19%
1 jan 1990 ano
72.134
+1.729
2.46%
1 jan 1991 ano
75.834
+3.699
5.13%
1 jan 1992 ano
77.372
+1.538
2.03%
1 jan 1993 ano
81.76
+4.388
5.67%
1 jan 1994 ano
84.812
+3.053
3.73%
1 jan 1995 ano
85.962
+1.15
1.36%
1 jan 1996 ano
122.273
+36.311
42.24%
1 jan 1997 ano
114.105
-8.168
-6.68%
1 jan 1998 ano
110.623
-3.482
-3.05%
1 jan 1999 ano
110.337
-0.286
-0.26%
1 jan 2000 ano
112.357
+2.02
1.83%
1 jan 2001 ano
119.334
+6.977
6.21%
1 jan 2002 ano
108.498
-10.836
-9.08%
1 jan 2003 ano
111.625
+3.127
2.88%
1 jan 2004 ano
107.721
-3.904
-3.5%
1 jan 2005 ano
103.464
-4.257
-3.95%
1 jan 2006 ano
104.372
+0.908
0.88%
1 jan 2007 ano
123.455
+19.083
18.28%
1 jan 2008 ano
129.537
+6.082
4.93%
1 jan 2009 ano
148.477
+18.94
14.62%
1 jan 2010 ano
147.736
-0.741
-0.5%
1 jan 2011 ano
153.256
+5.52
3.74%
1 jan 2012 ano
159.841
+6.585
4.3%
1 jan 2013 ano
164.81
+4.969
3.11%
1 jan 2014 ano
155.156
-9.653
-5.86%
1 jan 2015 ano
147.319
-7.837
-5.05%
1 jan 2016 ano
140.578
-6.741
-4.58%
Classificação de países por estatísticas atuais por anos


Comentários: