29
/pt/
pt
AIzaSyAYiBZKx7MnpbEhh9jyipgxe19OcubqV5w
April 1, 2024
159349
Ireland
IRL
true
2
1
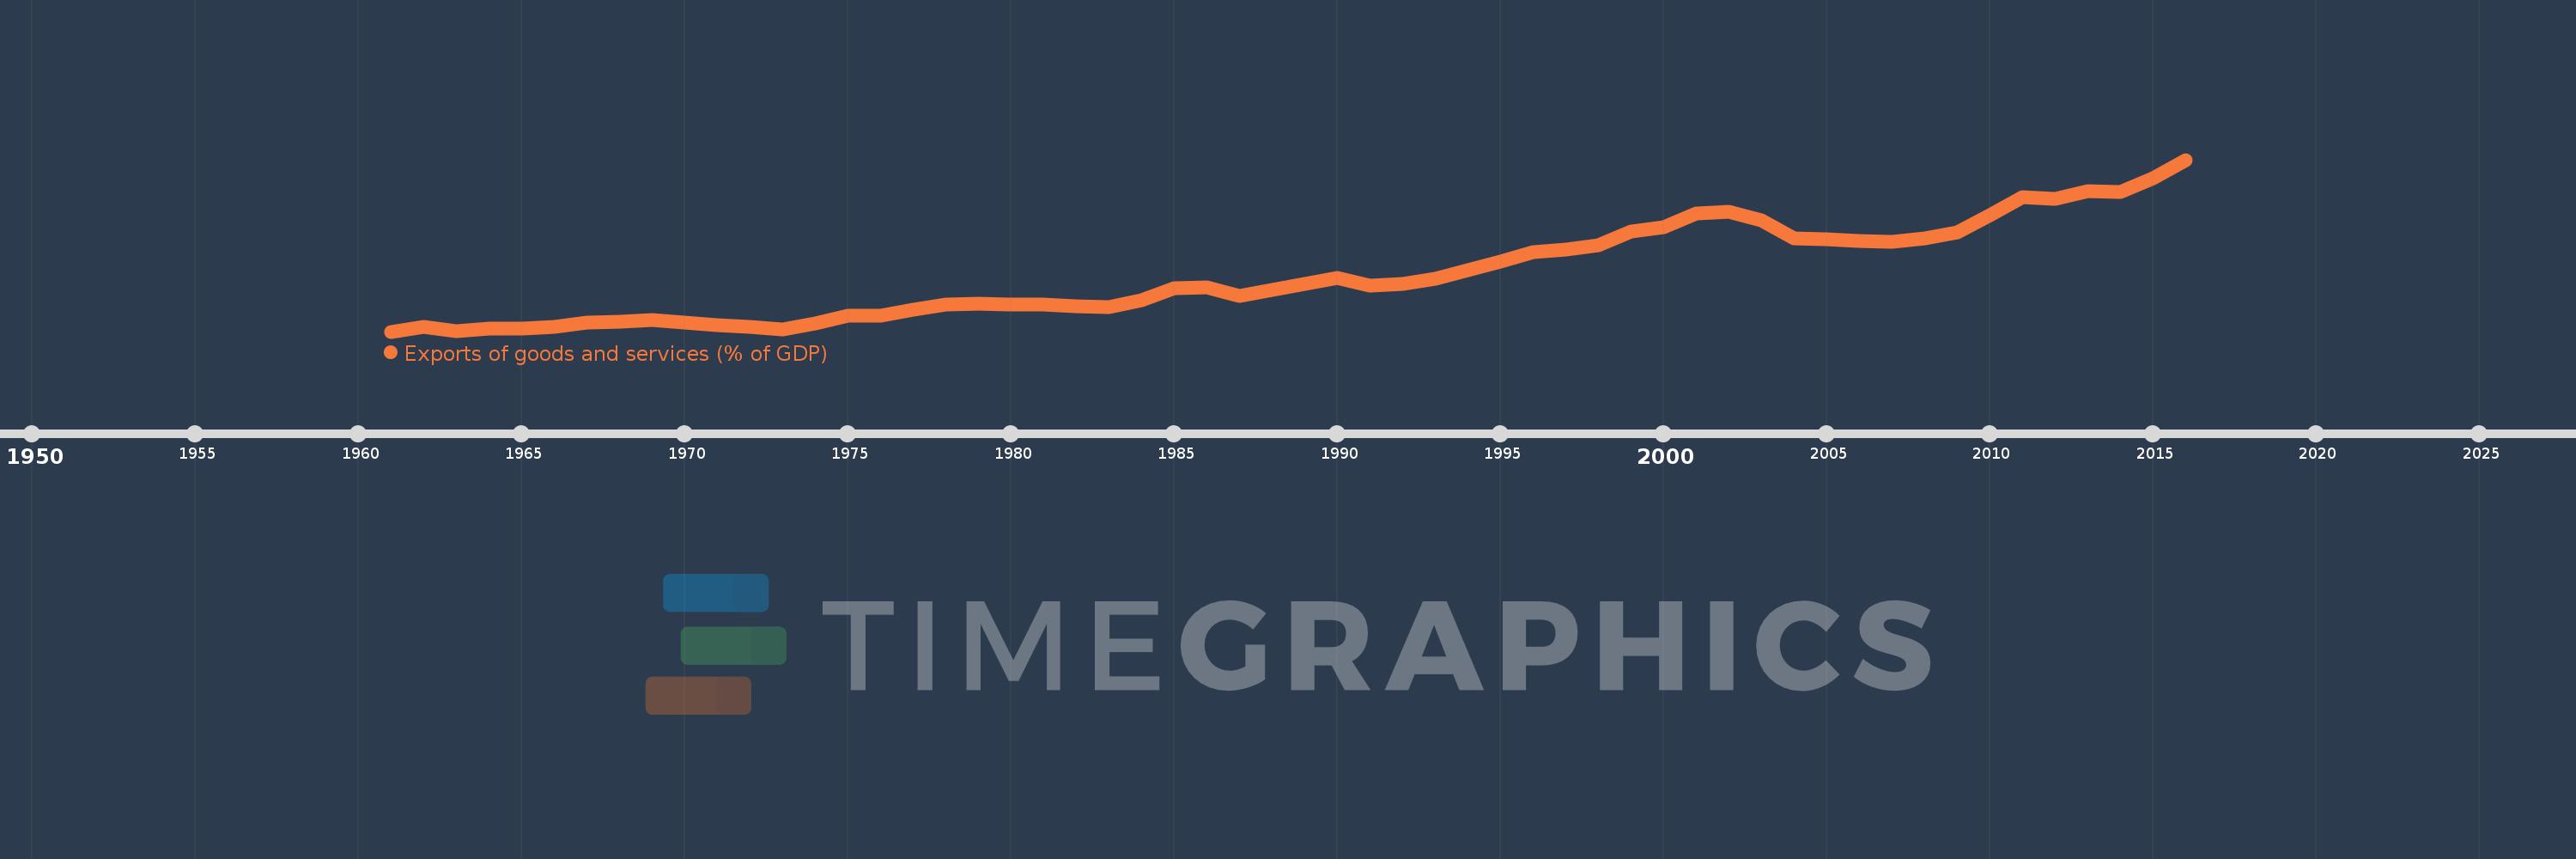
Exports of goods and services (% of GDP)
2016,2015,2014,2013,2012,2011,2010,2009,2008,2007,2006,2005,2004,2003,2002,2001,2000,1999,1998,1997,1996,1995,1994,1993,1992,1991,1990,1989,1988,1987,1986,1985,1984,1983,1982,1981,1980,1979,1978,1977,1976,1975,1974,1973,1972,1971,1970,1969,1968,1967,1966,1965,1964,1963,1962,1961
Estas estatísticas em outros países:
AfghanistanAlbaniaAlgeriaAngolaAntigua and BarbudaArab WorldArgentinaArmeniaArubaAustraliaAustriaAzerbaijanBahamas, TheBahrainBangladeshBarbadosBelarusBelgiumBelizeBeninBermudaBhutanBoliviaBosnia and HerzegovinaBotswanaBrazilBrunei DarussalamBulgariaBurkina FasoBurundiCabo VerdeCambodiaCameroonCanadaCaribbean small statesCentral African RepublicCentral Europe and the BalticsChadChileChinaColombiaComorosCongo, Dem. Rep.Congo, Rep.Costa RicaCote d'IvoireCroatiaCubaCyprusCzech RepublicDenmarkDjiboutiDominicaDominican RepublicEarly-demographic dividendEast Asia & PacificEast Asia & Pacific (excluding high income)East Asia & Pacific (IDA & IBRD countries)EcuadorEgypt, Arab Rep.El SalvadorEquatorial GuineaEritreaEstoniaEthiopiaEuro areaEurope & Central AsiaEurope & Central Asia (excluding high income)Europe & Central Asia (IDA & IBRD countries)European UnionFaroe IslandsFijiFinlandFragile and conflict affected situationsFranceFrench PolynesiaGabonGambia, TheGeorgiaGermanyGhanaGreeceGrenadaGuatemalaGuineaGuinea-BissauGuyanaHaitiHeavily indebted poor countries (HIPC)High incomeHondurasHong Kong SAR, ChinaHungaryIBRD onlyIcelandIDA & IBRD totalIDA blendIDA onlyIDA totalIndiaIndonesiaIran, Islamic Rep.IraqIrelandIsraelItalyJamaicaJapanJordanKazakhstanKenyaKiribatiKorea, Rep.KosovoKuwaitKyrgyz RepublicLao PDRLate-demographic dividendLatin America & Caribbean Latin America & Caribbean (excluding high income)Latin America & the Caribbean (IDA & IBRD countries)LatviaLeast developed countries: UN classificationLebanonLesothoLiberiaLibyaLithuaniaLow & middle incomeLow incomeLower middle incomeLuxembourgMacao SAR, ChinaMacedonia, FYRMadagascarMalawiMalaysiaMaldivesMaliMaltaMauritaniaMauritiusMexicoMicronesia, Fed. Sts.Middle East & North AfricaMiddle East & North Africa (excluding high income)Middle East & North Africa (IDA & IBRD countries)Middle incomeMoldovaMongoliaMontenegroMoroccoMozambiqueMyanmarNamibiaNepalNetherlandsNew CaledoniaNew ZealandNicaraguaNigerNigeriaNorth AmericaNorwayOECD membersOmanOther small statesPacific island small statesPakistanPalauPanamaPapua New GuineaParaguayPeruPhilippinesPolandPortugalPost-demographic dividendPre-demographic dividendPuerto RicoQatarRomaniaRussian FederationRwandaSamoaSaudi ArabiaSenegalSerbiaSeychellesSierra LeoneSingaporeSlovak RepublicSloveniaSmall statesSolomon IslandsSomaliaSouth AfricaSouth AsiaSouth Asia (IDA & IBRD)South SudanSpainSri LankaSt. Kitts and NevisSt. LuciaSt. Vincent and the GrenadinesSub-Saharan Africa Sub-Saharan Africa (excluding high income)Sub-Saharan Africa (IDA & IBRD countries)SudanSurinameSwazilandSwedenSwitzerlandSyrian Arab RepublicTajikistanTanzaniaThailandTimor-LesteTogoTongaTrinidad and TobagoTunisiaTurkeyTurkmenistanUgandaUkraineUnited Arab EmiratesUnited KingdomUnited StatesUpper middle incomeUruguayUzbekistanVanuatuVenezuela, RBVietnamWest Bank and GazaWorldYemen, Rep.ZambiaZimbabwe Linha do tempo:
Nesta escala de tempo está apresentado um gráfico de 1961 ano até 2016 ano Ireland. Dados de 1960 ano ausente. O número de observações reais por data: 56.
Fonte (nome):
Indicadores de desenvolvimento mundial
Fonte (organização):
World Bank national accounts data, and OECD National Accounts data files.
Categorias:
Economy & Growth, Trade
Foi atualizado:
23 abr 2017 ano
Indicadores de alterações dos valores ao longo dos anos
Mínimo:
29.527
1 jan 1961 ano
Máximo:
123.995
1 jan 2016 ano
Na data de observação
Valor
Mudança absoluta
A alteração em relação ao valor anterior
1 jan 1961 ano
29.527
+29.527
0.0%
1 jan 1962 ano
32.104
+2.577
8.73%
1 jan 1963 ano
29.908
-2.196
-6.84%
1 jan 1964 ano
31.116
+1.207
4.04%
1 jan 1965 ano
30.964
-0.152
-0.49%
1 jan 1966 ano
32.283
+1.319
4.26%
1 jan 1967 ano
34.536
+2.254
6.98%
1 jan 1968 ano
35.101
+0.565
1.64%
1 jan 1969 ano
36.021
+0.92
2.62%
1 jan 1970 ano
34.62
-1.402
-3.89%
1 jan 1971 ano
33.059
-1.561
-4.51%
1 jan 1972 ano
32.292
-0.767
-2.32%
1 jan 1973 ano
30.905
-1.387
-4.29%
1 jan 1974 ano
33.986
+3.08
9.97%
1 jan 1975 ano
38.07
+4.084
12.02%
1 jan 1976 ano
38.184
+0.114
0.3%
1 jan 1977 ano
41.369
+3.185
8.34%
1 jan 1978 ano
44.173
+2.804
6.78%
1 jan 1979 ano
44.656
+0.483
1.09%
1 jan 1980 ano
44.467
-0.189
-0.42%
1 jan 1981 ano
44.318
-0.149
-0.33%
1 jan 1982 ano
43.332
-0.986
-2.22%
1 jan 1983 ano
42.994
-0.338
-0.78%
1 jan 1984 ano
46.908
+3.914
9.1%
1 jan 1985 ano
53.258
+6.35
13.54%
1 jan 1986 ano
53.984
+0.727
1.36%
1 jan 1987 ano
49.051
-4.934
-9.14%
1 jan 1988 ano
52.388
+3.337
6.8%
1 jan 1989 ano
55.537
+3.149
6.01%
1 jan 1990 ano
58.87
+3.333
6.0%
1 jan 1991 ano
54.652
-4.218
-7.16%
1 jan 1992 ano
55.527
+0.875
1.6%
1 jan 1993 ano
58.348
+2.821
5.08%
1 jan 1994 ano
63.304
+4.957
8.49%
1 jan 1995 ano
67.893
+4.589
7.25%
1 jan 1996 ano
73.447
+5.554
8.18%
1 jan 1997 ano
74.834
+1.386
1.89%
1 jan 1998 ano
77.162
+2.328
3.11%
1 jan 1999 ano
84.488
+7.326
9.49%
1 jan 2000 ano
86.717
+2.229
2.64%
1 jan 2001 ano
94.488
+7.771
8.96%
1 jan 2002 ano
95.337
+0.849
0.9%
1 jan 2003 ano
90.48
-4.857
-5.09%
1 jan 2004 ano
80.851
-9.629
-10.64%
1 jan 2005 ano
80.537
-0.315
-0.39%
1 jan 2006 ano
79.57
-0.966
-1.2%
1 jan 2007 ano
78.974
-0.597
-0.75%
1 jan 2008 ano
80.745
+1.771
2.24%
1 jan 2009 ano
84.151
+3.406
4.22%
1 jan 2010 ano
93.454
+9.304
11.06%
1 jan 2011 ano
103.393
+9.939
10.63%
1 jan 2012 ano
102.446
-0.947
-0.92%
1 jan 2013 ano
106.776
+4.33
4.23%
1 jan 2014 ano
106.089
-0.686
-0.64%
1 jan 2015 ano
113.787
+7.697
7.26%
1 jan 2016 ano
123.995
+10.208
8.97%
Classificação de países por estatísticas atuais por anos


Comentários: