29
/pt/
pt
AIzaSyAYiBZKx7MnpbEhh9jyipgxe19OcubqV5w
April 1, 2024
164621
Jordan
JOR
true
2
1
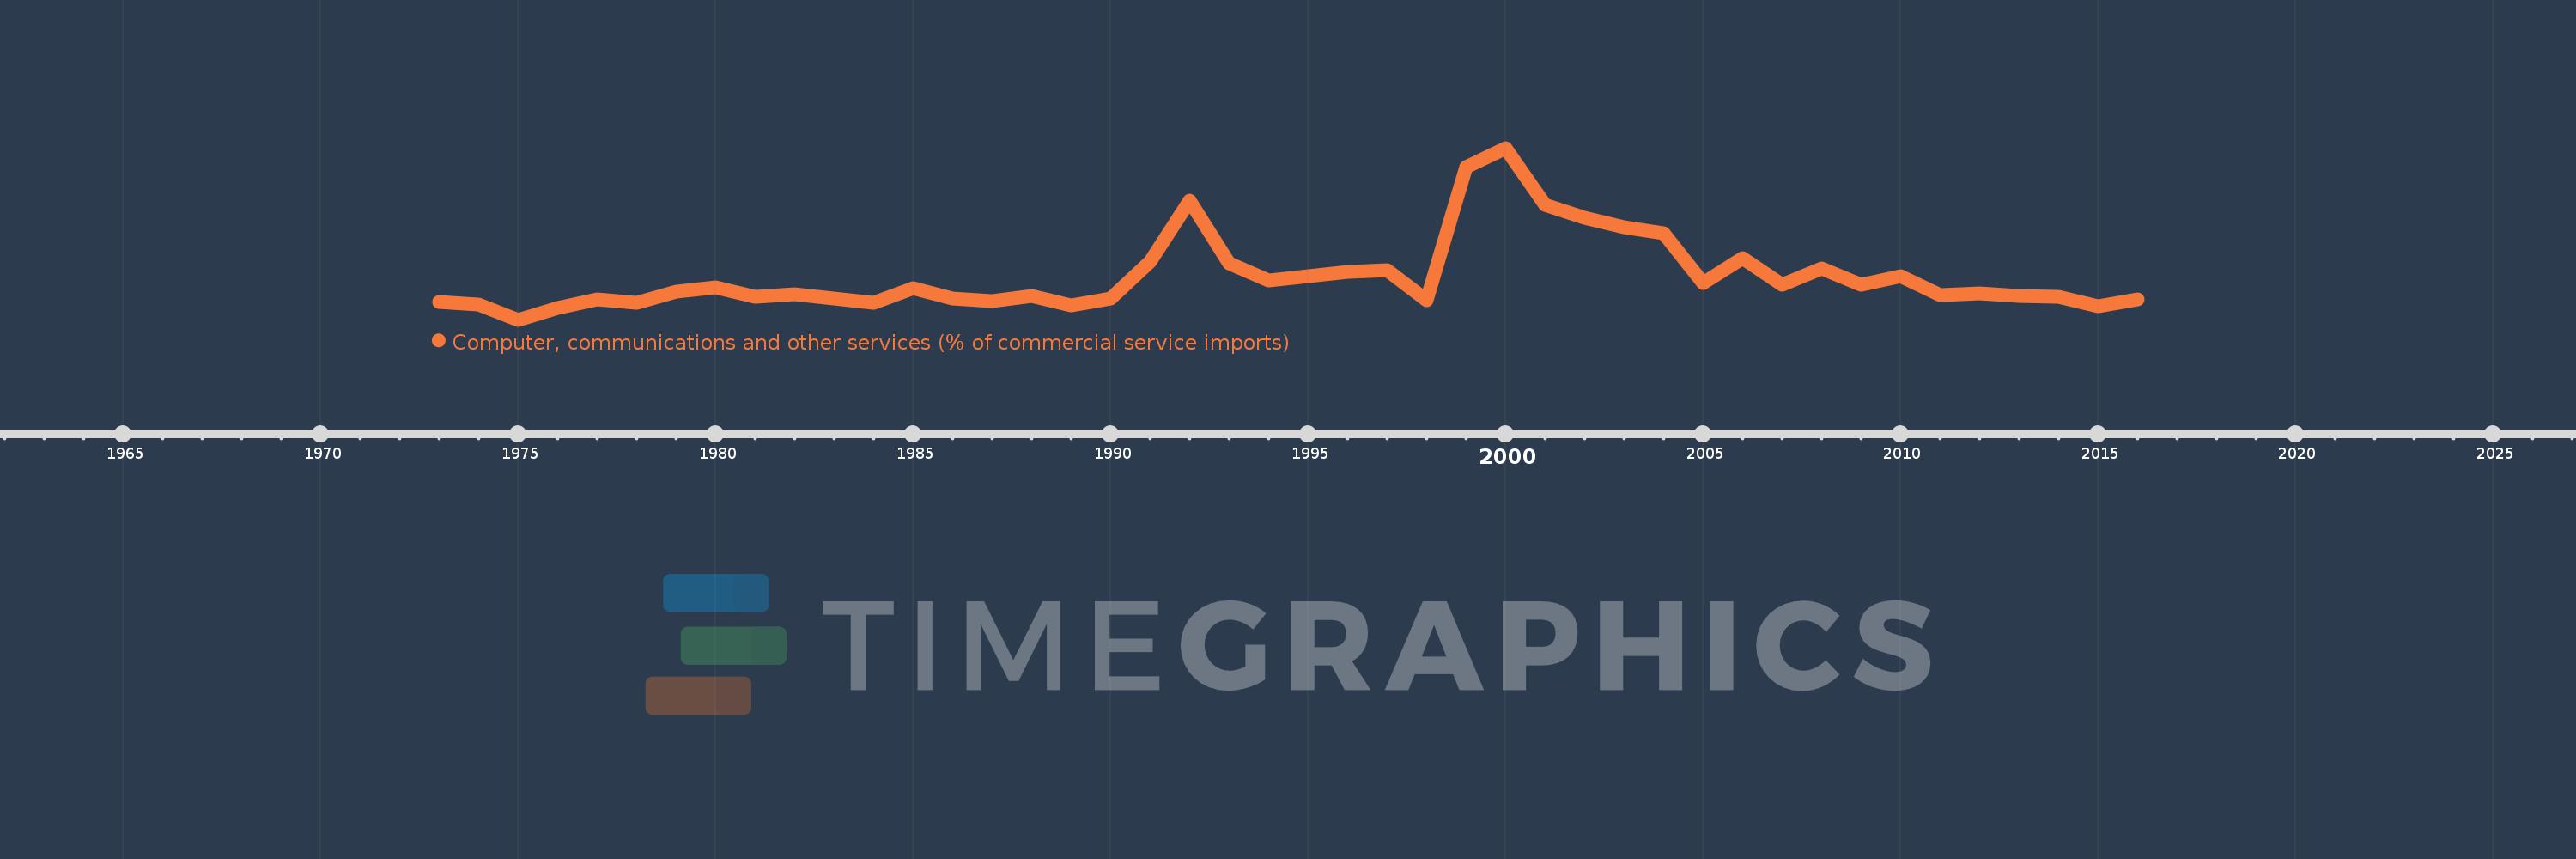
Computer, communications and other services (% of commercial service imports)
2016,2015,2014,2013,2012,2011,2010,2009,2008,2007,2006,2005,2004,2003,2002,2001,2000,1999,1998,1997,1996,1995,1994,1993,1992,1991,1990,1989,1988,1987,1986,1985,1984,1983,1982,1981,1980,1979,1978,1977,1976,1975,1974,1973
Estas estatísticas em outros países:
AfghanistanAlbaniaAlgeriaAngolaAntigua and BarbudaArab WorldArgentinaArmeniaArubaAustraliaAustriaAzerbaijanBahamas, TheBahrainBangladeshBarbadosBelarusBelgiumBelizeBeninBermudaBhutanBoliviaBosnia and HerzegovinaBotswanaBrazilBrunei DarussalamBulgariaBurkina FasoBurundiCabo VerdeCambodiaCameroonCanadaCaribbean small statesCentral African RepublicCentral Europe and the BalticsChadChileChinaColombiaComorosCongo, Dem. Rep.Congo, Rep.Costa RicaCote d'IvoireCroatiaCuracaoCyprusCzech RepublicDenmarkDjiboutiDominicaDominican RepublicEarly-demographic dividendEast Asia & PacificEast Asia & Pacific (excluding high income)East Asia & Pacific (IDA & IBRD countries)EcuadorEgypt, Arab Rep.El SalvadorEquatorial GuineaEritreaEstoniaEthiopiaEuro areaEurope & Central AsiaEurope & Central Asia (excluding high income)Europe & Central Asia (IDA & IBRD countries)European UnionFaroe IslandsFijiFinlandFragile and conflict affected situationsFranceFrench PolynesiaGabonGambia, TheGeorgiaGermanyGhanaGreeceGrenadaGuatemalaGuineaGuinea-BissauGuyanaHaitiHeavily indebted poor countries (HIPC)High incomeHondurasHong Kong SAR, ChinaHungaryIBRD onlyIcelandIDA & IBRD totalIDA onlyIDA totalIndiaIndonesiaIran, Islamic Rep.IraqIrelandIsraelItalyJamaicaJapanJordanKazakhstanKenyaKiribatiKorea, Rep.KosovoKuwaitKyrgyz RepublicLao PDRLate-demographic dividendLatin America & Caribbean Latin America & Caribbean (excluding high income)Latin America & the Caribbean (IDA & IBRD countries)LatviaLeast developed countries: UN classificationLebanonLesothoLiberiaLibyaLithuaniaLow & middle incomeLow incomeLower middle incomeLuxembourgMacao SAR, ChinaMacedonia, FYRMadagascarMalawiMalaysiaMaldivesMaliMaltaMarshall IslandsMauritaniaMauritiusMexicoMicronesia, Fed. Sts.Middle East & North AfricaMiddle East & North Africa (excluding high income)Middle East & North Africa (IDA & IBRD countries)Middle incomeMoldovaMongoliaMontenegroMoroccoMozambiqueMyanmarNamibiaNepalNetherlandsNew CaledoniaNew ZealandNicaraguaNigerNigeriaNorth AmericaNorwayOECD membersOmanOther small statesPacific island small statesPakistanPalauPanamaPapua New GuineaParaguayPeruPhilippinesPolandPortugalPost-demographic dividendPre-demographic dividendQatarRomaniaRussian FederationRwandaSamoaSao Tome and PrincipeSaudi ArabiaSenegalSerbiaSeychellesSierra LeoneSingaporeSint Maarten (Dutch part)Slovak RepublicSloveniaSmall statesSolomon IslandsSouth AfricaSouth AsiaSouth Asia (IDA & IBRD)South SudanSpainSri LankaSt. Kitts and NevisSt. LuciaSt. Vincent and the GrenadinesSub-Saharan Africa Sub-Saharan Africa (excluding high income)Sub-Saharan Africa (IDA & IBRD countries)SudanSurinameSwazilandSwedenSwitzerlandSyrian Arab RepublicTajikistanTanzaniaThailandTimor-LesteTogoTongaTrinidad and TobagoTunisiaTurkeyTuvaluUgandaUkraineUnited KingdomUnited StatesUpper middle incomeUruguayVanuatuVenezuela, RBWest Bank and GazaWorldYemen, Rep.ZambiaZimbabwe Linha do tempo:
Nesta escala de tempo está apresentado um gráfico de 1973 ano até 2016 ano Jordan. Dados de 1972 ano ausente. O número de observações reais por data: 44.
Fonte (nome):
Indicadores de desenvolvimento mundial
Fonte (organização):
International Monetary Fund, Balance of Payments Statistics Yearbook and data files.
Categorias:
Private Sector, Trade
Foi atualizado:
23 abr 2017 ano
Indicadores de alterações dos valores ao longo dos anos
Mínimo:
2.797
1 jan 1975 ano
Máximo:
32.115
1 jan 2000 ano
Na data de observação
Valor
Mudança absoluta
A alteração em relação ao valor anterior
1 jan 1973 ano
5.904
+5.904
0.0%
1 jan 1974 ano
5.369
-0.535
-9.06%
1 jan 1975 ano
2.797
-2.572
-47.9%
1 jan 1976 ano
4.804
+2.007
71.74%
1 jan 1977 ano
6.238
+1.434
29.84%
1 jan 1978 ano
5.693
-0.544
-8.73%
1 jan 1979 ano
7.573
+1.88
33.02%
1 jan 1980 ano
8.363
+0.789
10.42%
1 jan 1981 ano
6.771
-1.591
-19.03%
1 jan 1982 ano
7.215
+0.444
6.55%
1 jan 1983 ano
6.433
-0.782
-10.84%
1 jan 1984 ano
5.642
-0.791
-12.3%
1 jan 1985 ano
8.14
+2.498
44.28%
1 jan 1986 ano
6.413
-1.727
-21.21%
1 jan 1987 ano
5.981
-0.432
-6.73%
1 jan 1988 ano
6.905
+0.924
15.45%
1 jan 1989 ano
5.225
-1.68
-24.33%
1 jan 1990 ano
6.435
+1.21
23.15%
1 jan 1991 ano
12.681
+6.246
97.06%
1 jan 1992 ano
23.088
+10.407
82.07%
1 jan 1993 ano
12.46
-10.628
-46.03%
1 jan 1994 ano
9.558
-2.902
-23.29%
1 jan 1995 ano
10.178
+0.62
6.49%
1 jan 1996 ano
10.917
+0.739
7.26%
1 jan 1997 ano
11.299
+0.382
3.5%
1 jan 1998 ano
6.158
-5.141
-45.5%
1 jan 1999 ano
28.781
+22.622
367.34%
1 jan 2000 ano
32.115
+3.334
11.58%
1 jan 2001 ano
22.418
-9.696
-30.19%
1 jan 2002 ano
20.197
-2.222
-9.91%
1 jan 2003 ano
18.53
-1.667
-8.25%
1 jan 2004 ano
17.621
-0.909
-4.91%
1 jan 2005 ano
9.06
-8.561
-48.58%
1 jan 2006 ano
13.333
+4.272
47.15%
1 jan 2007 ano
8.777
-4.556
-34.17%
1 jan 2008 ano
11.494
+2.717
30.96%
1 jan 2009 ano
8.743
-2.751
-23.94%
1 jan 2010 ano
10.287
+1.544
17.66%
1 jan 2011 ano
7.058
-3.228
-31.38%
1 jan 2012 ano
7.293
+0.235
3.33%
1 jan 2013 ano
6.902
-0.391
-5.37%
1 jan 2014 ano
6.693
-0.209
-3.02%
1 jan 2015 ano
5.123
-1.57
-23.46%
1 jan 2016 ano
6.285
+1.162
22.68%
Classificação de países por estatísticas atuais por anos


Comentários: