29
/pt/
pt
AIzaSyAYiBZKx7MnpbEhh9jyipgxe19OcubqV5w
April 1, 2024
120752
Dominica
DMA
true
2
1
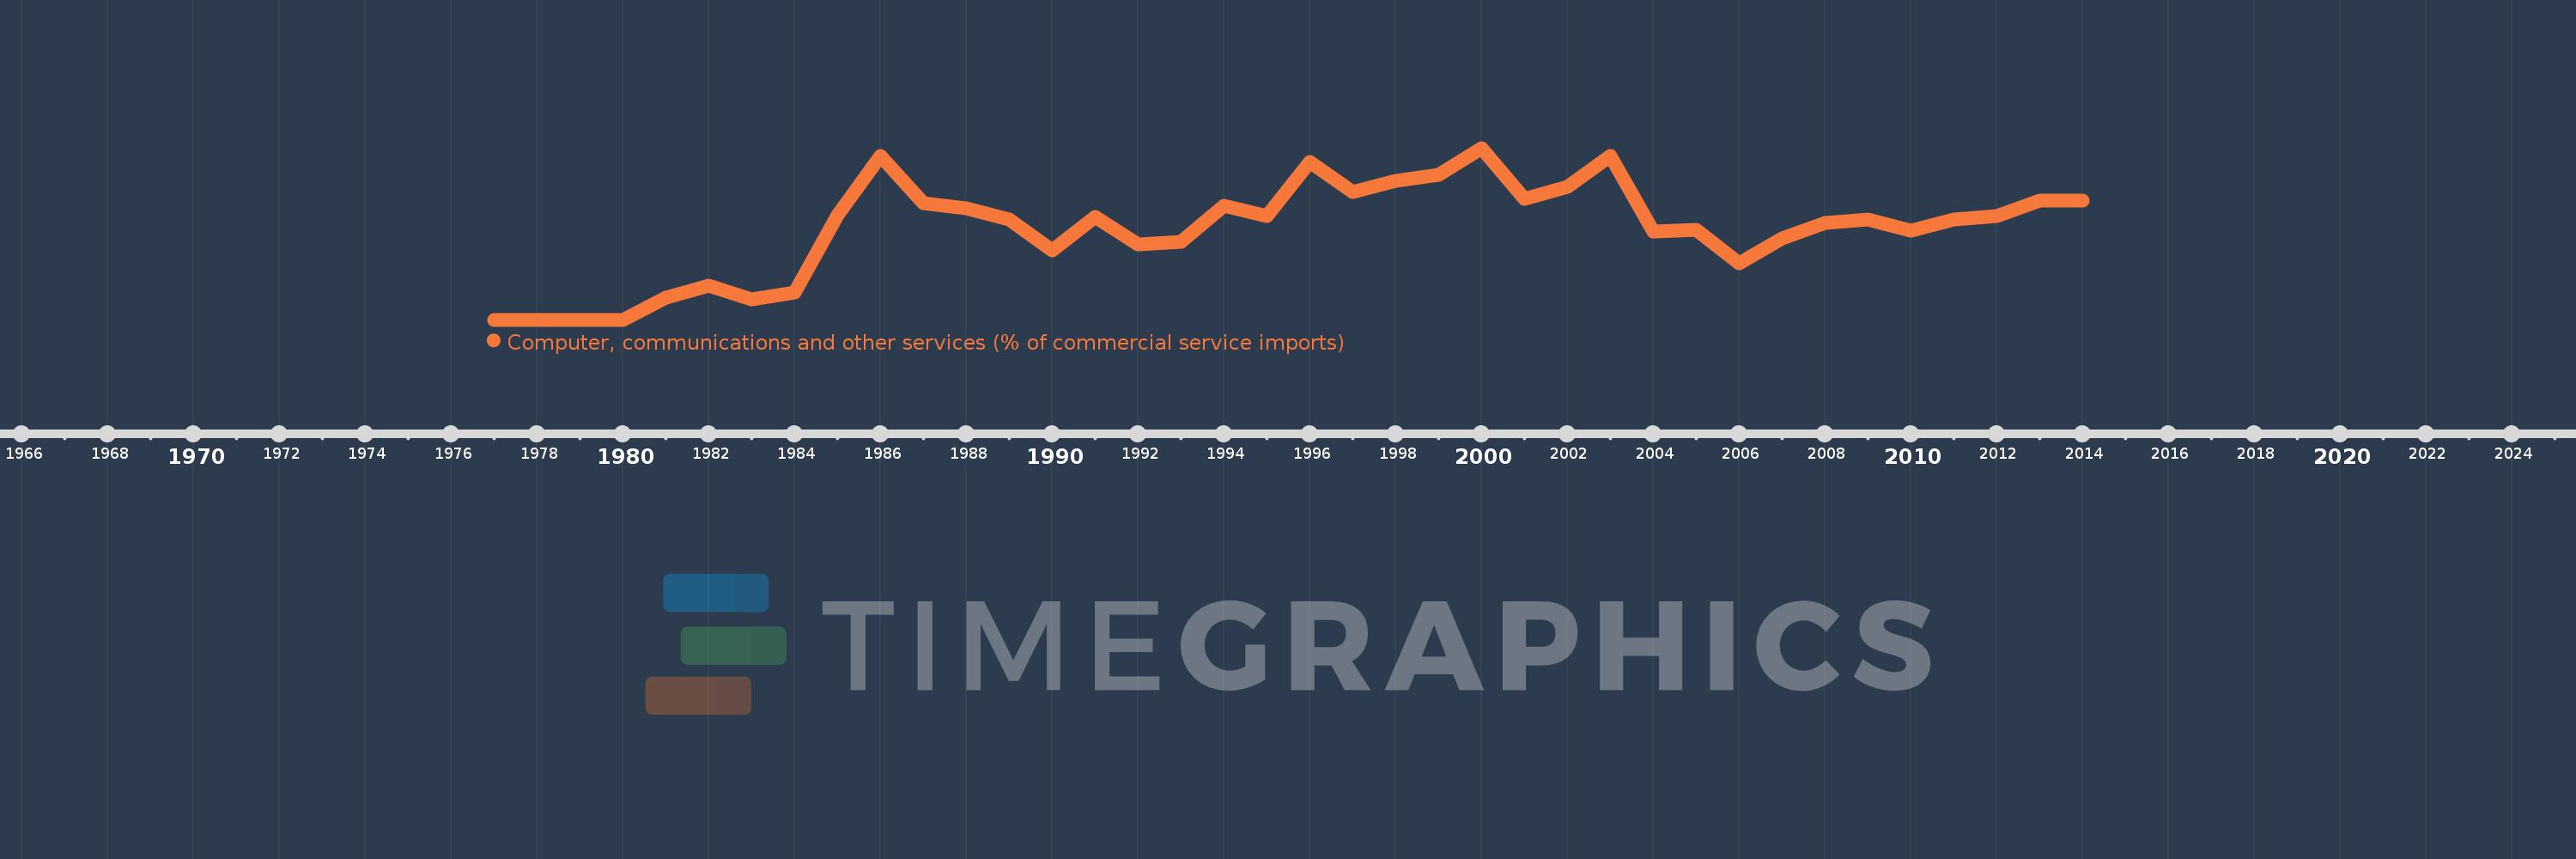
Computer, communications and other services (% of commercial service imports)
2014,2013,2012,2011,2010,2009,2008,2007,2006,2005,2004,2003,2002,2001,2000,1999,1998,1997,1996,1995,1994,1993,1992,1991,1990,1989,1988,1987,1986,1985,1984,1983,1982,1981,1980,1979,1978,1977
Estas estatísticas em outros países:
AfghanistanAlbaniaAlgeriaAngolaAntigua and BarbudaArab WorldArgentinaArmeniaArubaAustraliaAustriaAzerbaijanBahamas, TheBahrainBangladeshBarbadosBelarusBelgiumBelizeBeninBermudaBhutanBoliviaBosnia and HerzegovinaBotswanaBrazilBrunei DarussalamBulgariaBurkina FasoBurundiCabo VerdeCambodiaCameroonCanadaCaribbean small statesCentral African RepublicCentral Europe and the BalticsChadChileChinaColombiaComorosCongo, Dem. Rep.Congo, Rep.Costa RicaCote d'IvoireCroatiaCuracaoCyprusCzech RepublicDenmarkDjiboutiDominicaDominican RepublicEarly-demographic dividendEast Asia & PacificEast Asia & Pacific (excluding high income)East Asia & Pacific (IDA & IBRD countries)EcuadorEgypt, Arab Rep.El SalvadorEquatorial GuineaEritreaEstoniaEthiopiaEuro areaEurope & Central AsiaEurope & Central Asia (excluding high income)Europe & Central Asia (IDA & IBRD countries)European UnionFaroe IslandsFijiFinlandFragile and conflict affected situationsFranceFrench PolynesiaGabonGambia, TheGeorgiaGermanyGhanaGreeceGrenadaGuatemalaGuineaGuinea-BissauGuyanaHaitiHeavily indebted poor countries (HIPC)High incomeHondurasHong Kong SAR, ChinaHungaryIBRD onlyIcelandIDA & IBRD totalIDA onlyIDA totalIndiaIndonesiaIran, Islamic Rep.IraqIrelandIsraelItalyJamaicaJapanJordanKazakhstanKenyaKiribatiKorea, Rep.KosovoKuwaitKyrgyz RepublicLao PDRLate-demographic dividendLatin America & Caribbean Latin America & Caribbean (excluding high income)Latin America & the Caribbean (IDA & IBRD countries)LatviaLeast developed countries: UN classificationLebanonLesothoLiberiaLibyaLithuaniaLow & middle incomeLow incomeLower middle incomeLuxembourgMacao SAR, ChinaMacedonia, FYRMadagascarMalawiMalaysiaMaldivesMaliMaltaMarshall IslandsMauritaniaMauritiusMexicoMicronesia, Fed. Sts.Middle East & North AfricaMiddle East & North Africa (excluding high income)Middle East & North Africa (IDA & IBRD countries)Middle incomeMoldovaMongoliaMontenegroMoroccoMozambiqueMyanmarNamibiaNepalNetherlandsNew CaledoniaNew ZealandNicaraguaNigerNigeriaNorth AmericaNorwayOECD membersOmanOther small statesPacific island small statesPakistanPalauPanamaPapua New GuineaParaguayPeruPhilippinesPolandPortugalPost-demographic dividendPre-demographic dividendQatarRomaniaRussian FederationRwandaSamoaSao Tome and PrincipeSaudi ArabiaSenegalSerbiaSeychellesSierra LeoneSingaporeSint Maarten (Dutch part)Slovak RepublicSloveniaSmall statesSolomon IslandsSouth AfricaSouth AsiaSouth Asia (IDA & IBRD)South SudanSpainSri LankaSt. Kitts and NevisSt. LuciaSt. Vincent and the GrenadinesSub-Saharan Africa Sub-Saharan Africa (excluding high income)Sub-Saharan Africa (IDA & IBRD countries)SudanSurinameSwazilandSwedenSwitzerlandSyrian Arab RepublicTajikistanTanzaniaThailandTimor-LesteTogoTongaTrinidad and TobagoTunisiaTurkeyTuvaluUgandaUkraineUnited KingdomUnited StatesUpper middle incomeUruguayVanuatuVenezuela, RBWest Bank and GazaWorldYemen, Rep.ZambiaZimbabwe Linha do tempo:
Nesta escala de tempo está apresentado um gráfico de 1977 ano até 2014 ano Dominica. Dados de 1976 ano ausente. O número de observações reais por data: 38.
Fonte (nome):
Indicadores de desenvolvimento mundial
Fonte (organização):
International Monetary Fund, Balance of Payments Statistics Yearbook and data files.
Categorias:
Private Sector, Trade
Foi atualizado:
23 abr 2017 ano
Indicadores de alterações dos valores ao longo dos anos
Máximo:
36.365
1 jan 2000 ano
Na data de observação
Valor
Mudança absoluta
A alteração em relação ao valor anterior
1 jan 1977 ano
0.0
0.0
0.0%
1 jan 1978 ano
0.0
+0.0
-115.79%
1 jan 1979 ano
0.0
0.0
-100.0%
1 jan 1981 ano
4.731
+4.731
11097.87 trilhões%
1 jan 1982 ano
7.223
+2.492
52.67%
1 jan 1983 ano
4.334
-2.889
-40.0%
1 jan 1984 ano
5.81
+1.476
34.05%
1 jan 1985 ano
22.157
+16.348
281.39%
1 jan 1986 ano
34.746
+12.589
56.82%
1 jan 1987 ano
24.615
-10.13
-29.16%
1 jan 1988 ano
23.532
-1.084
-4.4%
1 jan 1989 ano
21.161
-2.371
-10.08%
1 jan 1990 ano
14.597
-6.564
-31.02%
1 jan 1991 ano
21.725
+7.128
48.83%
1 jan 1992 ano
15.873
-5.852
-26.93%
1 jan 1993 ano
16.488
+0.614
3.87%
1 jan 1994 ano
24.044
+7.556
45.83%
1 jan 1995 ano
21.995
-2.048
-8.52%
1 jan 1996 ano
33.463
+11.468
52.14%
1 jan 1997 ano
26.978
-6.486
-19.38%
1 jan 1998 ano
29.487
+2.51
9.3%
1 jan 1999 ano
30.624
+1.137
3.86%
1 jan 2000 ano
36.365
+5.74
18.74%
1 jan 2001 ano
25.649
-10.715
-29.47%
1 jan 2002 ano
28.092
+2.443
9.52%
1 jan 2003 ano
34.624
+6.532
23.25%
1 jan 2004 ano
18.743
-15.881
-45.87%
1 jan 2005 ano
18.963
+0.221
1.18%
1 jan 2006 ano
11.892
-7.071
-37.29%
1 jan 2007 ano
17.304
+5.412
45.51%
1 jan 2008 ano
20.426
+3.122
18.04%
1 jan 2009 ano
21.154
+0.729
3.57%
1 jan 2010 ano
18.822
-2.332
-11.02%
1 jan 2011 ano
21.238
+2.416
12.83%
1 jan 2012 ano
21.857
+0.619
2.91%
1 jan 2013 ano
25.253
+3.397
15.54%
1 jan 2014 ano
25.169
-0.085
-0.33%
Classificação de países por estatísticas atuais por anos


Comentários: