29
/pt/
pt
AIzaSyAYiBZKx7MnpbEhh9jyipgxe19OcubqV5w
April 1, 2024
164286
Japan
JPN
true
2
1
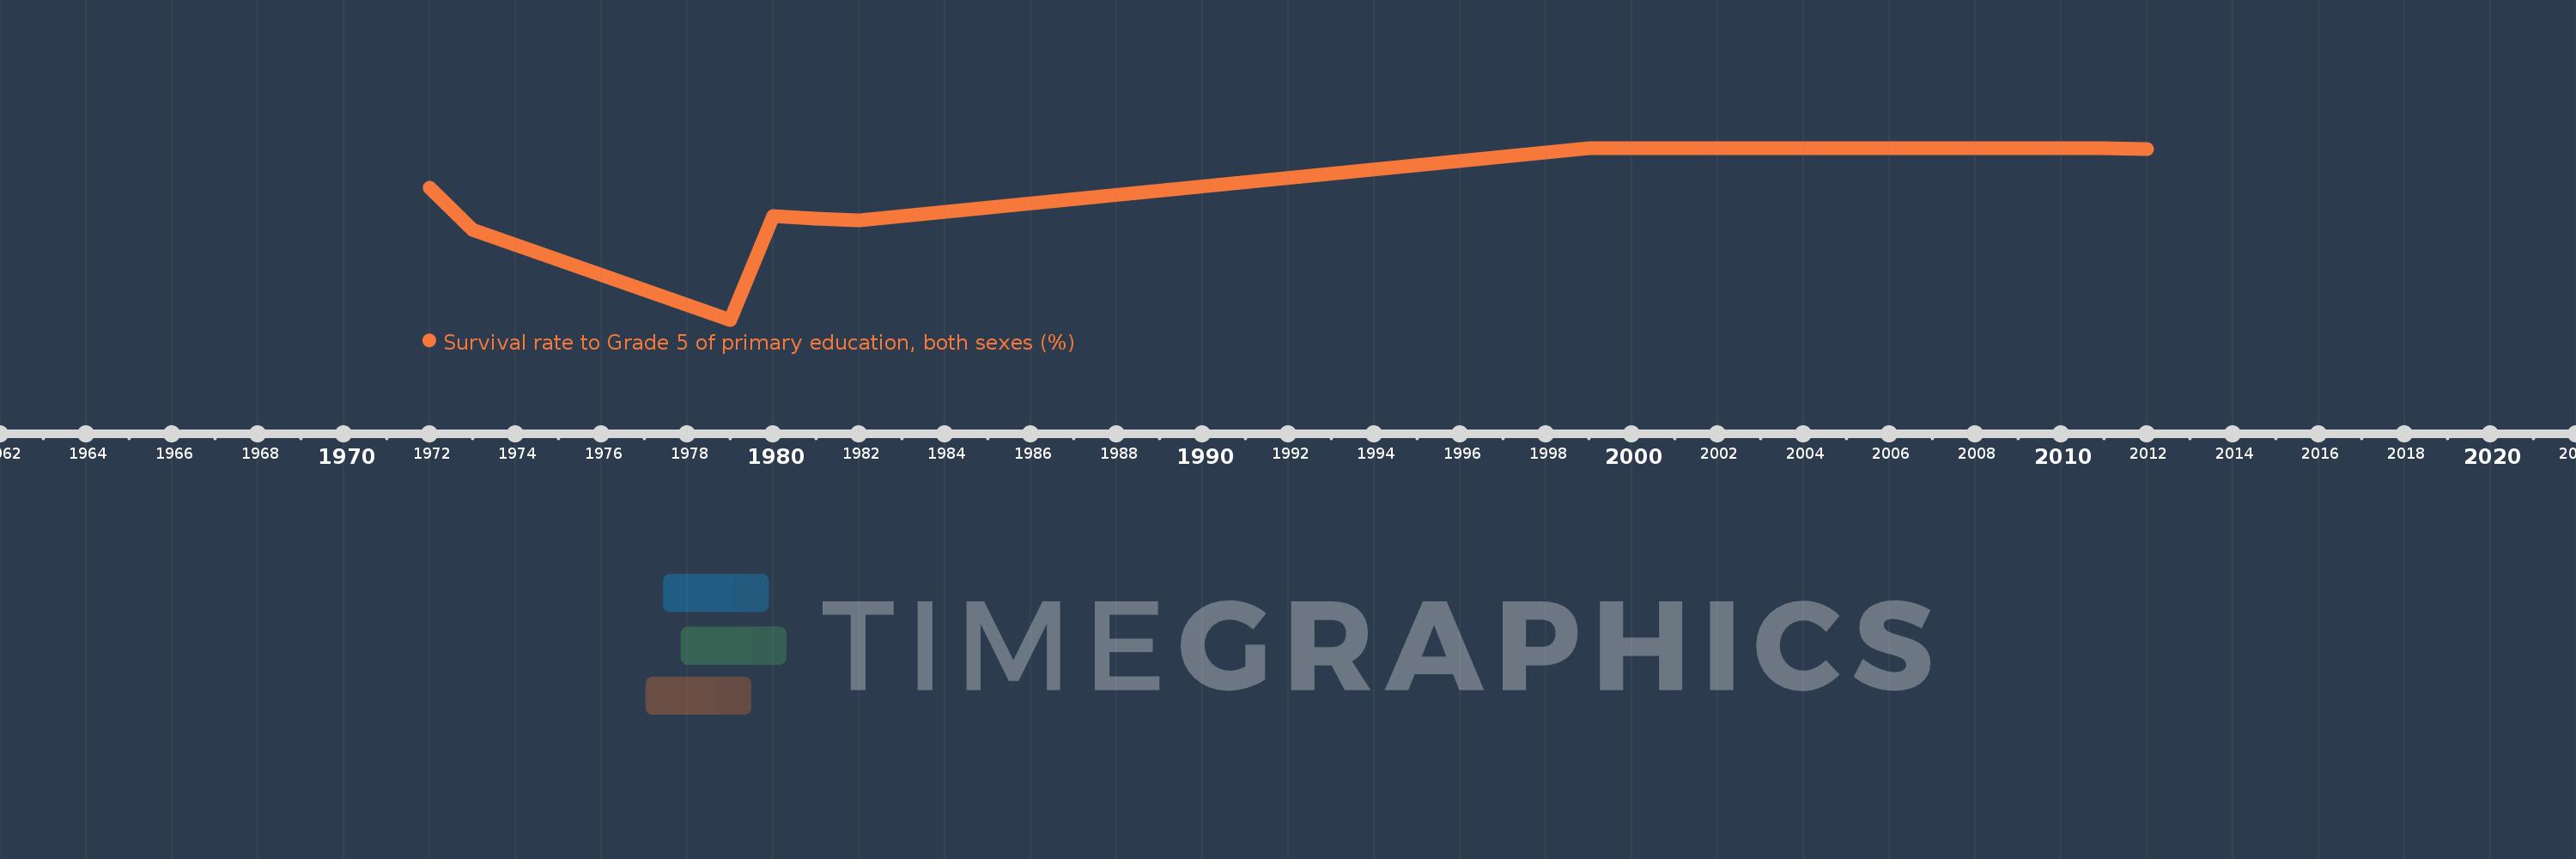
Survival rate to Grade 5 of primary education, both sexes (%)
2012,2011,2010,2009,2007,2006,2005,2004,2003,2002,2001,2000,1999,1982,1981,1980,1979,1973,1972
Estas estatísticas em outros países:
AfghanistanAlbaniaAlgeriaAndorraAngolaAntigua and BarbudaArab WorldArgentinaArubaBahamas, TheBahrainBangladeshBarbadosBelarusBelgiumBelizeBeninBermudaBhutanBoliviaBosnia and HerzegovinaBotswanaBritish Virgin IslandsBrunei DarussalamBurkina FasoBurundiCabo VerdeCambodiaCameroonCanadaCaribbean small statesCayman IslandsCentral African RepublicChadChileChinaColombiaComorosCongo, Dem. Rep.Congo, Rep.Costa RicaCote d'IvoireCubaCyprusCzech RepublicDenmarkDjiboutiDominicaDominican RepublicEarly-demographic dividendEast Asia & PacificEast Asia & Pacific (excluding high income)East Asia & Pacific (IDA & IBRD countries)EcuadorEgypt, Arab Rep.El SalvadorEquatorial GuineaEritreaEstoniaEthiopiaFijiFinlandFranceGabonGambia, TheGeorgiaGhanaGreeceGrenadaGuatemalaGuineaGuinea-BissauGuyanaHaitiHeavily indebted poor countries (HIPC)HondurasHong Kong SAR, ChinaHungaryIBRD onlyIcelandIDA blendIDA onlyIDA totalIndiaIndonesiaIran, Islamic Rep.IraqIrelandIsraelItalyJamaicaJapanJordanKenyaKiribatiKorea, Rep.KuwaitLao PDRLate-demographic dividendLatviaLeast developed countries: UN classificationLebanonLesothoLiberiaLibyaLiechtensteinLow incomeLower middle incomeLuxembourgMacao SAR, ChinaMadagascarMalawiMalaysiaMaldivesMaliMaltaMarshall IslandsMauritaniaMauritiusMexicoMiddle East & North AfricaMiddle East & North Africa (excluding high income)Middle East & North Africa (IDA & IBRD countries)MonacoMontenegroMoroccoMozambiqueMyanmarNamibiaNepalNetherlandsNicaraguaNigerNigeriaNorwayOmanOther small statesPacific island small statesPakistanPanamaPapua New GuineaParaguayPeruPhilippinesPolandPortugalPre-demographic dividendQatarRwandaSamoaSan MarinoSao Tome and PrincipeSaudi ArabiaSenegalSeychellesSierra LeoneSingaporeSloveniaSolomon IslandsSouth AfricaSouth AsiaSouth Asia (IDA & IBRD)SpainSri LankaSt. Kitts and NevisSt. LuciaSt. Vincent and the GrenadinesSub-Saharan Africa Sub-Saharan Africa (excluding high income)Sub-Saharan Africa (IDA & IBRD countries)SudanSurinameSwazilandSwedenSwitzerlandSyrian Arab RepublicTanzaniaThailandTimor-LesteTogoTongaTrinidad and TobagoTunisiaTurkeyTuvaluUgandaUnited Arab EmiratesUpper middle incomeUruguayVanuatuVenezuela, RBVietnamYemen, Rep.ZambiaZimbabwe Linha do tempo:
Nesta escala de tempo está apresentado um gráfico de 1972 ano até 2012 ano Japan. Dados de 1971 ano ausente. O número de observações reais por data: 19.
Fonte (nome):
Indicadores de desenvolvimento mundial
Fonte (organização):
UNESCO Institute for Statistics
Categorias:
Education
Foi atualizado:
23 abr 2017 ano
Indicadores de alterações dos valores ao longo dos anos
Mínimo:
80.381
1 jan 1979 ano
Máximo:
99.988
1 jan 2009 ano
Na data de observação
Valor
Mudança absoluta
A alteração em relação ao valor anterior
1 jan 1972 ano
95.492
+95.492
0.0%
1 jan 1973 ano
90.651
-4.841
-5.07%
1 jan 1979 ano
80.381
-10.27
-11.33%
1 jan 1980 ano
92.167
+11.786
14.66%
1 jan 1981 ano
91.942
-0.225
-0.24%
1 jan 1982 ano
91.735
-0.207
-0.23%
1 jan 1999 ano
99.981
+8.246
8.99%
1 jan 2000 ano
99.977
-0.004
0.0%
1 jan 2001 ano
99.952
-0.025
-0.03%
1 jan 2002 ano
99.967
+0.015
0.02%
1 jan 2003 ano
99.961
-0.006
-0.01%
1 jan 2004 ano
99.968
+0.007
0.01%
1 jan 2005 ano
99.937
-0.032
-0.03%
1 jan 2006 ano
99.924
-0.013
-0.01%
1 jan 2007 ano
99.977
+0.054
0.05%
1 jan 2009 ano
99.988
+0.011
0.01%
1 jan 2010 ano
99.954
-0.035
-0.03%
1 jan 2011 ano
99.937
-0.017
-0.02%
1 jan 2012 ano
99.846
-0.091
-0.09%
Classificação de países por estatísticas atuais por anos


Comentários: