29
/pt/
pt
AIzaSyAYiBZKx7MnpbEhh9jyipgxe19OcubqV5w
April 1, 2024
137413
Gambia, The
GMB
true
2
1
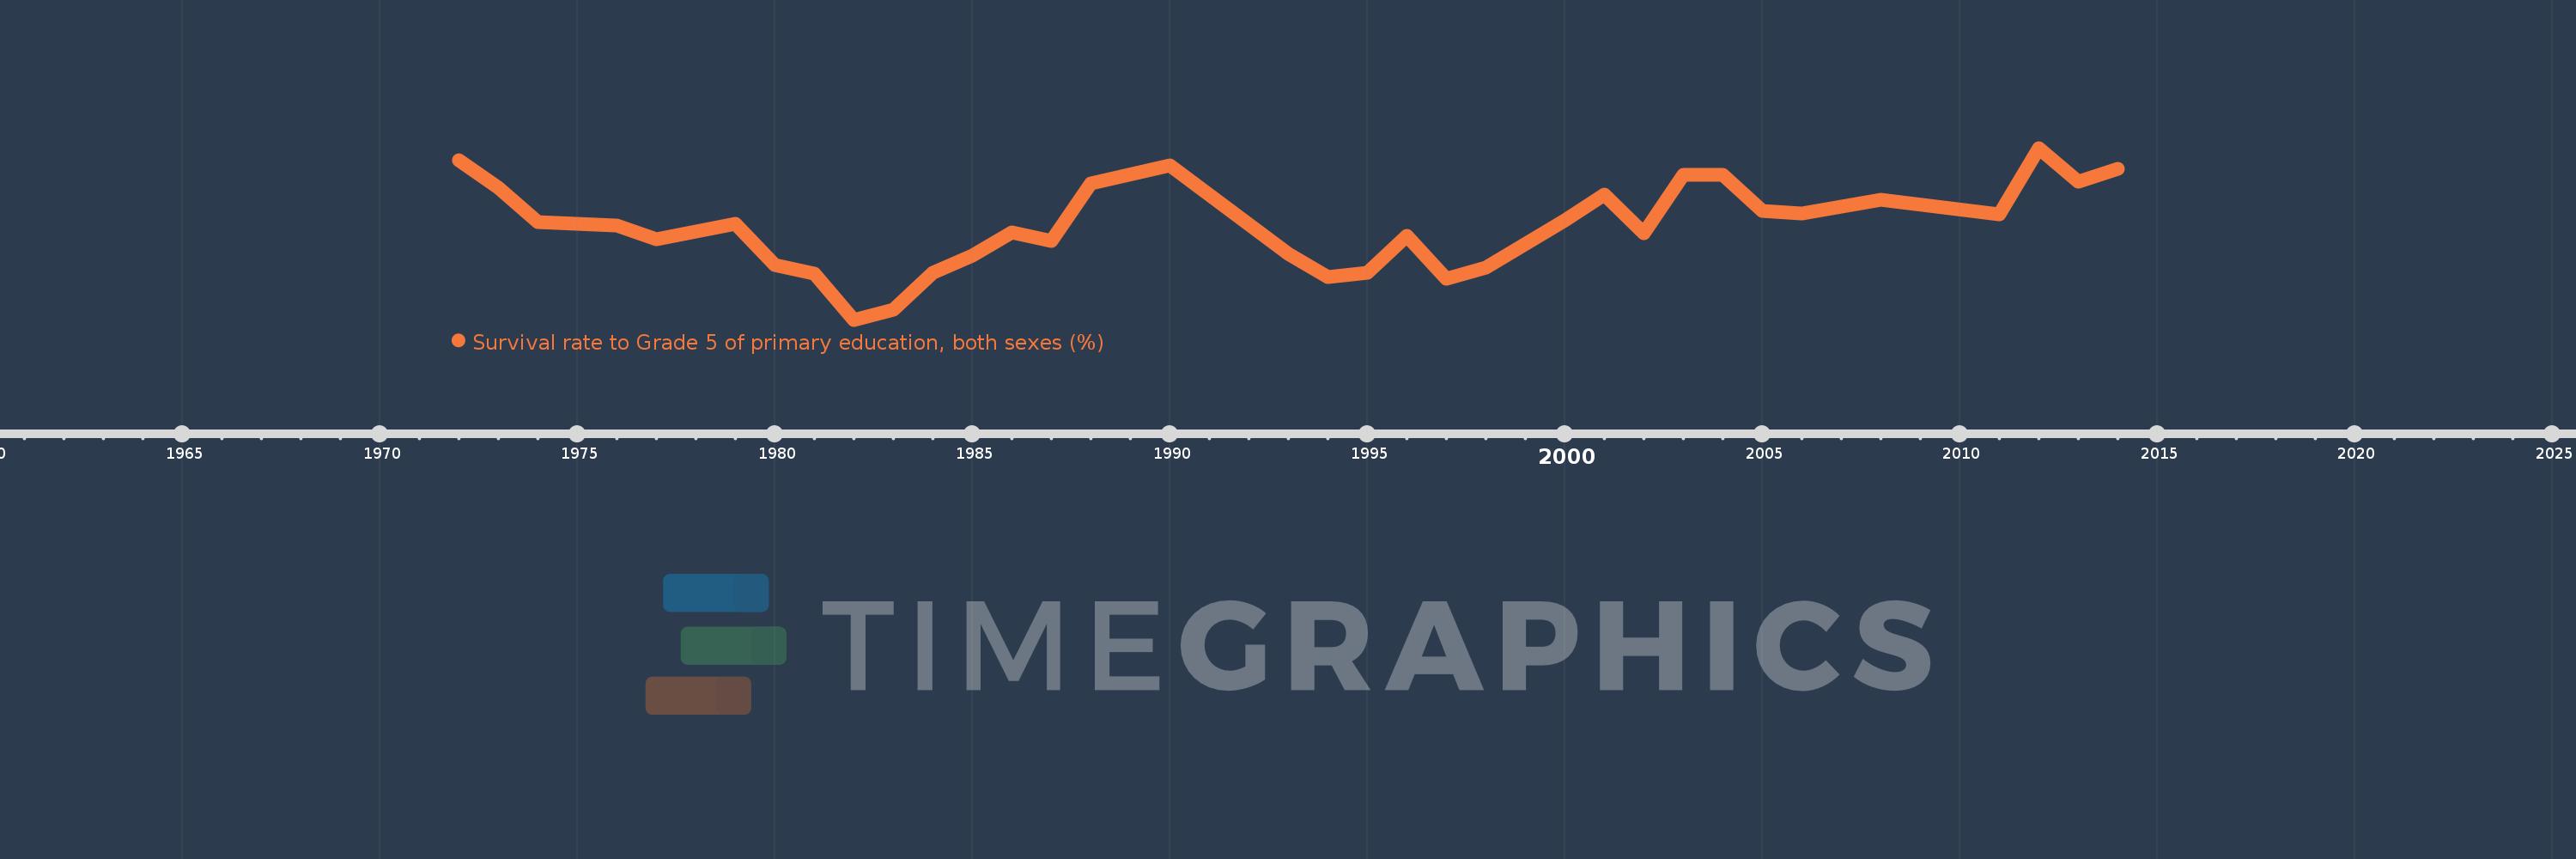
Survival rate to Grade 5 of primary education, both sexes (%)
2014,2013,2012,2011,2008,2006,2005,2004,2003,2002,2001,2000,1998,1997,1996,1995,1994,1993,1990,1988,1987,1986,1985,1984,1983,1982,1981,1980,1979,1977,1976,1974,1973,1972
Estas estatísticas em outros países:
AfghanistanAlbaniaAlgeriaAndorraAngolaAntigua and BarbudaArab WorldArgentinaArubaBahamas, TheBahrainBangladeshBarbadosBelarusBelgiumBelizeBeninBermudaBhutanBoliviaBosnia and HerzegovinaBotswanaBritish Virgin IslandsBrunei DarussalamBurkina FasoBurundiCabo VerdeCambodiaCameroonCanadaCaribbean small statesCayman IslandsCentral African RepublicChadChileChinaColombiaComorosCongo, Dem. Rep.Congo, Rep.Costa RicaCote d'IvoireCubaCyprusCzech RepublicDenmarkDjiboutiDominicaDominican RepublicEarly-demographic dividendEast Asia & PacificEast Asia & Pacific (excluding high income)East Asia & Pacific (IDA & IBRD countries)EcuadorEgypt, Arab Rep.El SalvadorEquatorial GuineaEritreaEstoniaEthiopiaFijiFinlandFranceGabonGambia, TheGeorgiaGhanaGreeceGrenadaGuatemalaGuineaGuinea-BissauGuyanaHaitiHeavily indebted poor countries (HIPC)HondurasHong Kong SAR, ChinaHungaryIBRD onlyIcelandIDA blendIDA onlyIDA totalIndiaIndonesiaIran, Islamic Rep.IraqIrelandIsraelItalyJamaicaJapanJordanKenyaKiribatiKorea, Rep.KuwaitLao PDRLate-demographic dividendLatviaLeast developed countries: UN classificationLebanonLesothoLiberiaLibyaLiechtensteinLow incomeLower middle incomeLuxembourgMacao SAR, ChinaMadagascarMalawiMalaysiaMaldivesMaliMaltaMarshall IslandsMauritaniaMauritiusMexicoMiddle East & North AfricaMiddle East & North Africa (excluding high income)Middle East & North Africa (IDA & IBRD countries)MonacoMontenegroMoroccoMozambiqueMyanmarNamibiaNepalNetherlandsNicaraguaNigerNigeriaNorwayOmanOther small statesPacific island small statesPakistanPanamaPapua New GuineaParaguayPeruPhilippinesPolandPortugalPre-demographic dividendQatarRwandaSamoaSan MarinoSao Tome and PrincipeSaudi ArabiaSenegalSeychellesSierra LeoneSingaporeSloveniaSolomon IslandsSouth AfricaSouth AsiaSouth Asia (IDA & IBRD)SpainSri LankaSt. Kitts and NevisSt. LuciaSt. Vincent and the GrenadinesSub-Saharan Africa Sub-Saharan Africa (excluding high income)Sub-Saharan Africa (IDA & IBRD countries)SudanSurinameSwazilandSwedenSwitzerlandSyrian Arab RepublicTanzaniaThailandTimor-LesteTogoTongaTrinidad and TobagoTunisiaTurkeyTuvaluUgandaUnited Arab EmiratesUpper middle incomeUruguayVanuatuVenezuela, RBVietnamYemen, Rep.ZambiaZimbabwe Linha do tempo:
Nesta escala de tempo está apresentado um gráfico de 1972 ano até 2014 ano Gambia, The. Dados de 1971 ano ausente. O número de observações reais por data: 34.
Fonte (nome):
Indicadores de desenvolvimento mundial
Fonte (organização):
UNESCO Institute for Statistics
Categorias:
Education
Foi atualizado:
23 abr 2017 ano
Indicadores de alterações dos valores ao longo dos anos
Mínimo:
38.145
1 jan 1982 ano
Máximo:
85.85
1 jan 2012 ano
Na data de observação
Valor
Mudança absoluta
A alteração em relação ao valor anterior
1 jan 1972 ano
82.387
+82.387
0.0%
1 jan 1973 ano
74.803
-7.584
-9.21%
1 jan 1974 ano
65.226
-9.577
-12.8%
1 jan 1976 ano
64.314
-0.912
-1.4%
1 jan 1977 ano
60.461
-3.853
-5.99%
1 jan 1979 ano
64.89
+4.429
7.33%
1 jan 1980 ano
53.233
-11.658
-17.97%
1 jan 1981 ano
50.842
-2.39
-4.49%
1 jan 1982 ano
38.145
-12.698
-24.97%
1 jan 1983 ano
40.862
+2.718
7.12%
1 jan 1984 ano
51.158
+10.296
25.2%
1 jan 1985 ano
56.038
+4.88
9.54%
1 jan 1986 ano
62.441
+6.402
11.42%
1 jan 1987 ano
60.079
-2.361
-3.78%
1 jan 1988 ano
76.04
+15.961
26.57%
1 jan 1990 ano
81.04
+5.0
6.58%
1 jan 1993 ano
56.448
-24.591
-30.34%
1 jan 1994 ano
50.019
-6.43
-11.39%
1 jan 1995 ano
51.18
+1.161
2.32%
1 jan 1996 ano
61.332
+10.153
19.84%
1 jan 1997 ano
49.442
-11.89
-19.39%
1 jan 1998 ano
52.587
+3.145
6.36%
1 jan 2000 ano
65.796
+13.208
25.12%
1 jan 2001 ano
72.997
+7.202
10.95%
1 jan 2002 ano
62.072
-10.926
-14.97%
1 jan 2003 ano
78.476
+16.405
26.43%
1 jan 2004 ano
78.415
-0.062
-0.08%
1 jan 2005 ano
68.413
-10.002
-12.75%
1 jan 2006 ano
67.74
-0.673
-0.98%
1 jan 2008 ano
71.54
+3.8
5.61%
1 jan 2011 ano
67.415
-4.125
-5.77%
1 jan 2012 ano
85.85
+18.436
27.35%
1 jan 2013 ano
76.532
-9.319
-10.85%
1 jan 2014 ano
80.135
+3.603
4.71%
Classificação de países por estatísticas atuais por anos


Comentários: