29
/pt/
pt
AIzaSyAYiBZKx7MnpbEhh9jyipgxe19OcubqV5w
April 1, 2024
150525
Honduras
HND
true
2
1
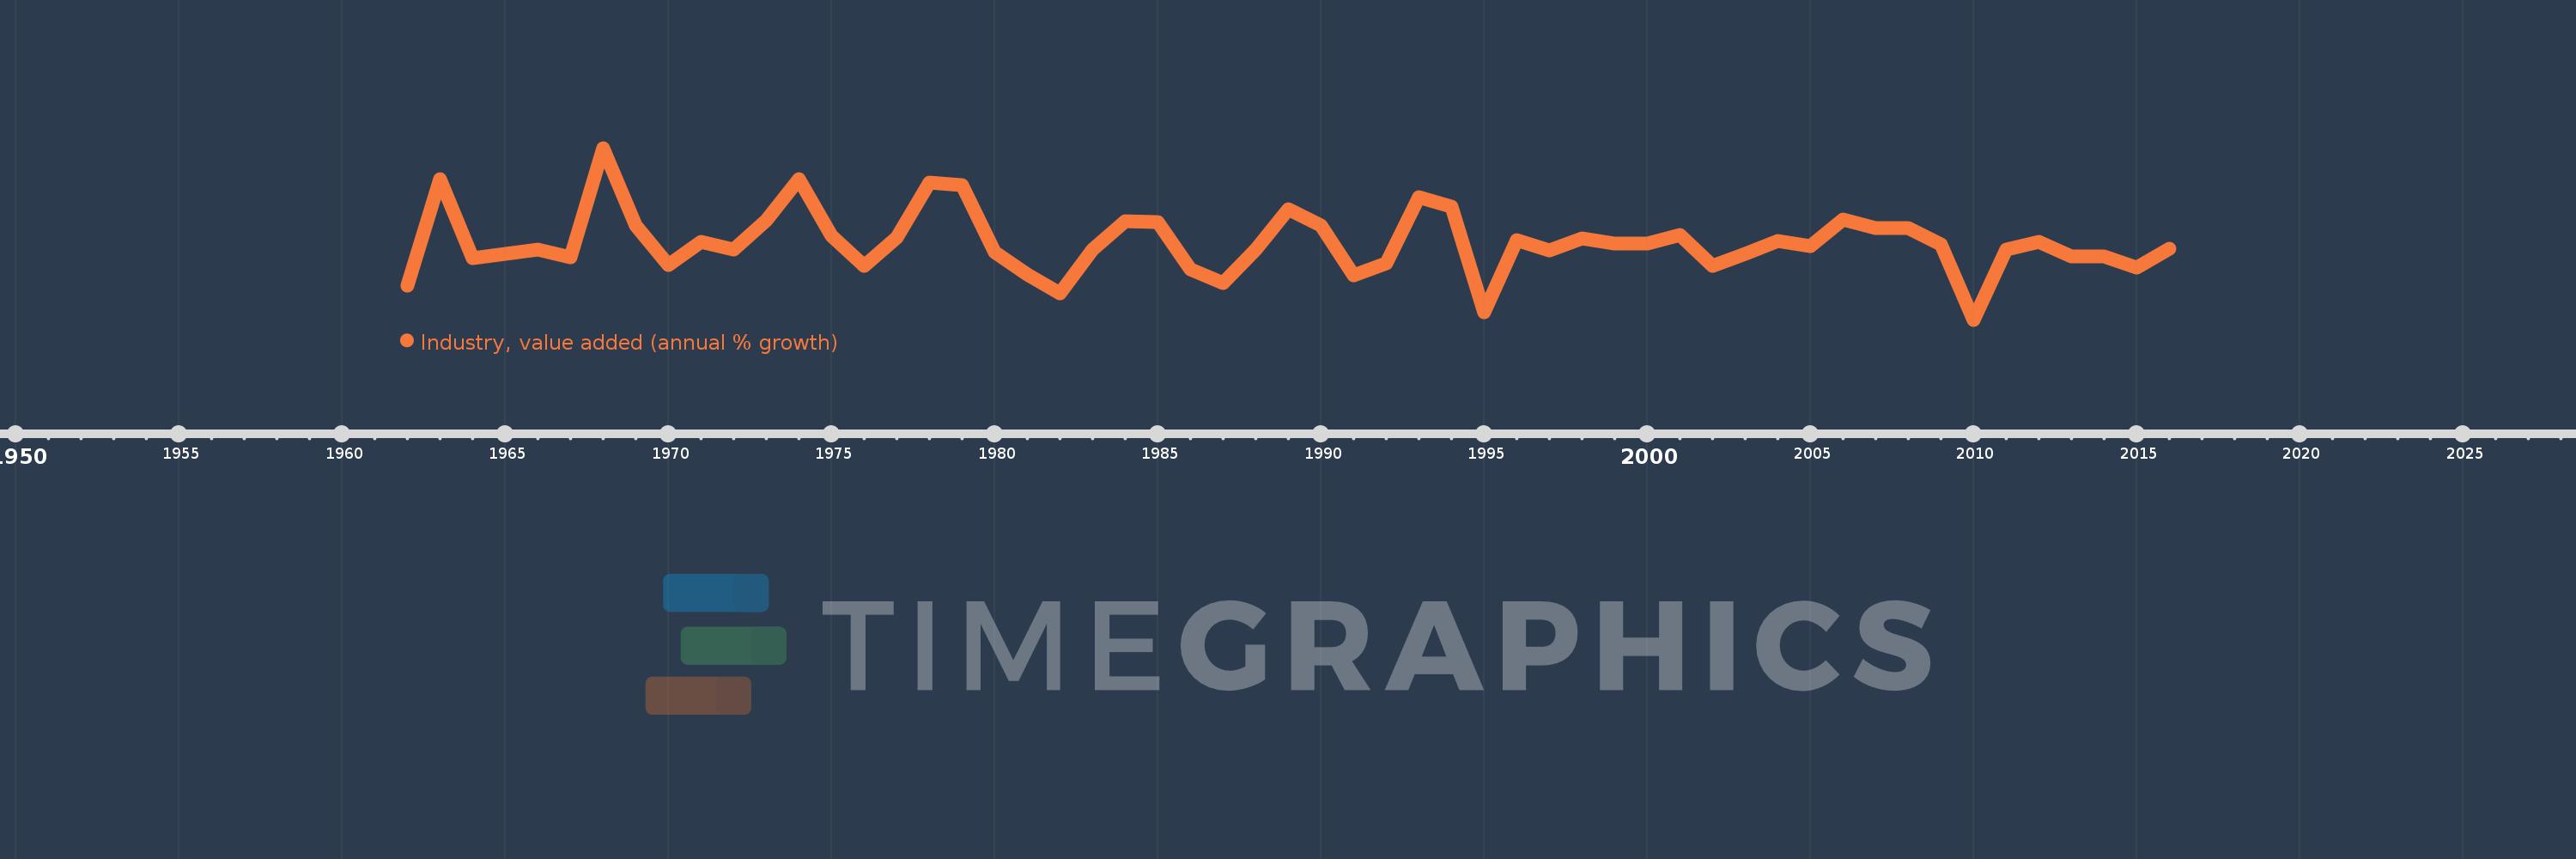
Industry, value added (annual % growth)
2016,2015,2014,2013,2012,2011,2010,2009,2008,2007,2006,2005,2004,2003,2002,2001,2000,1999,1998,1997,1996,1995,1994,1993,1992,1991,1990,1989,1988,1987,1986,1985,1984,1983,1982,1981,1980,1979,1978,1977,1976,1975,1974,1973,1972,1971,1970,1969,1968,1967,1966,1965,1964,1963,1962
Estas estatísticas em outros países:
AfghanistanAlbaniaAlgeriaAntigua and BarbudaArab WorldArgentinaArmeniaAustraliaAustriaAzerbaijanBahamas, TheBahrainBangladeshBelarusBelgiumBelizeBeninBermudaBhutanBoliviaBosnia and HerzegovinaBotswanaBrazilBrunei DarussalamBulgariaBurkina FasoBurundiCabo VerdeCambodiaCameroonCanadaCaribbean small statesCayman IslandsCentral African RepublicCentral Europe and the BalticsChadChileChinaColombiaComorosCongo, Dem. Rep.Congo, Rep.Costa RicaCote d'IvoireCroatiaCubaCyprusCzech RepublicDenmarkDjiboutiDominicaDominican RepublicEarly-demographic dividendEast Asia & PacificEast Asia & Pacific (excluding high income)East Asia & Pacific (IDA & IBRD countries)EcuadorEgypt, Arab Rep.El SalvadorEquatorial GuineaEritreaEstoniaEthiopiaEuro areaEurope & Central AsiaEurope & Central Asia (excluding high income)Europe & Central Asia (IDA & IBRD countries)European UnionFijiFinlandFragile and conflict affected situationsFranceGabonGambia, TheGeorgiaGermanyGhanaGreeceGrenadaGuatemalaGuineaGuinea-BissauGuyanaHaitiHeavily indebted poor countries (HIPC)High incomeHondurasHong Kong SAR, ChinaHungaryIBRD onlyIcelandIDA & IBRD totalIDA blendIDA onlyIDA totalIndiaIndonesiaIran, Islamic Rep.IraqIrelandItalyJamaicaJapanJordanKazakhstanKenyaKiribatiKorea, Rep.KosovoKuwaitKyrgyz RepublicLao PDRLate-demographic dividendLatin America & Caribbean Latin America & Caribbean (excluding high income)Latin America & the Caribbean (IDA & IBRD countries)LatviaLeast developed countries: UN classificationLebanonLesothoLiberiaLithuaniaLow & middle incomeLow incomeLower middle incomeLuxembourgMacedonia, FYRMadagascarMalawiMalaysiaMaldivesMaliMarshall IslandsMauritaniaMauritiusMexicoMicronesia, Fed. Sts.Middle East & North AfricaMiddle East & North Africa (excluding high income)Middle East & North Africa (IDA & IBRD countries)Middle incomeMoldovaMongoliaMontenegroMoroccoMozambiqueMyanmarNamibiaNepalNetherlandsNew ZealandNicaraguaNigerNigeriaNorth AmericaNorwayOECD membersOmanOther small statesPacific island small statesPakistanPalauPanamaPapua New GuineaParaguayPeruPhilippinesPolandPortugalPost-demographic dividendPre-demographic dividendPuerto RicoQatarRomaniaRussian FederationRwandaSamoaSao Tome and PrincipeSaudi ArabiaSenegalSerbiaSeychellesSierra LeoneSingaporeSlovak RepublicSloveniaSmall statesSolomon IslandsSomaliaSouth AfricaSouth AsiaSouth Asia (IDA & IBRD)SpainSri LankaSt. Kitts and NevisSt. LuciaSt. Vincent and the GrenadinesSub-Saharan Africa Sub-Saharan Africa (excluding high income)Sub-Saharan Africa (IDA & IBRD countries)SudanSurinameSwazilandSwedenSwitzerlandSyrian Arab RepublicTajikistanTanzaniaThailandTimor-LesteTogoTongaTrinidad and TobagoTunisiaTurkeyTurkmenistanTuvaluUgandaUkraineUnited Arab EmiratesUnited KingdomUnited StatesUpper middle incomeUruguayUzbekistanVanuatuVenezuela, RBVietnamWest Bank and GazaWorldZambiaZimbabwe Linha do tempo:
Nesta escala de tempo está apresentado um gráfico de 1962 ano até 2016 ano Honduras. Dados de 1961 ano ausente. O número de observações reais por data: 55.
Fonte (nome):
Indicadores de desenvolvimento mundial
Fonte (organização):
World Bank national accounts data, and OECD National Accounts data files.
Categorias:
Economy & Growth
Foi atualizado:
23 abr 2017 ano
Indicadores de alterações dos valores ao longo dos anos
Mínimo:
-7.693
1 jan 2010 ano
Máximo:
18.48
1 jan 1968 ano
Na data de observação
Valor
Mudança absoluta
A alteração em relação ao valor anterior
1 jan 1962 ano
-2.497
-2.497
0.0%
1 jan 1963 ano
13.679
+16.176
-647.94%
1 jan 1964 ano
1.728
-11.952
-87.37%
1 jan 1965 ano
2.396
+0.668
38.68%
1 jan 1966 ano
2.991
+0.595
24.84%
1 jan 1967 ano
1.783
-1.208
-40.39%
1 jan 1968 ano
18.48
+16.697
936.36%
1 jan 1969 ano
6.654
-11.826
-63.99%
1 jan 1970 ano
0.626
-6.028
-90.59%
1 jan 1971 ano
4.222
+3.596
574.35%
1 jan 1972 ano
2.985
-1.237
-29.3%
1 jan 1973 ano
7.453
+4.468
149.69%
1 jan 1974 ano
13.68
+6.227
83.54%
1 jan 1975 ano
5.085
-8.595
-62.83%
1 jan 1976 ano
0.484
-4.601
-90.48%
1 jan 1977 ano
4.815
+4.332
895.18%
1 jan 1978 ano
13.17
+8.355
173.5%
1 jan 1979 ano
12.855
-0.315
-2.39%
1 jan 1980 ano
2.638
-10.217
-79.48%
1 jan 1981 ano
-0.818
-3.456
-131.0%
1 jan 1982 ano
-3.651
-2.834
346.51%
1 jan 1983 ano
2.934
+6.585
-180.35%
1 jan 1984 ano
7.363
+4.429
150.97%
1 jan 1985 ano
7.19
-0.173
-2.35%
1 jan 1986 ano
0.0
-7.19
-100.0%
1 jan 1987 ano
-2.167
-2.167
%
1 jan 1988 ano
3.059
+5.226
-241.15%
1 jan 1989 ano
9.11
+6.05
197.79%
1 jan 1990 ano
6.66
-2.449
-26.89%
1 jan 1991 ano
-0.88
-7.54
-113.21%
1 jan 1992 ano
0.887
+1.767
-200.89%
1 jan 1993 ano
10.994
+10.107
1.14 mil%
1 jan 1994 ano
9.588
-1.406
-12.79%
1 jan 1995 ano
-6.508
-16.096
-167.87%
1 jan 1996 ano
4.486
+10.993
-168.93%
1 jan 1997 ano
2.887
-1.599
-35.65%
1 jan 1998 ano
4.676
+1.79
61.99%
1 jan 1999 ano
3.918
-0.759
-16.23%
1 jan 2000 ano
3.968
+0.051
1.29%
1 jan 2001 ano
5.216
+1.248
31.45%
1 jan 2002 ano
0.466
-4.75
-91.07%
1 jan 2003 ano
2.391
+1.925
413.09%
1 jan 2004 ano
4.353
+1.963
82.11%
1 jan 2005 ano
3.501
-0.852
-19.58%
1 jan 2006 ano
7.636
+4.135
118.09%
1 jan 2007 ano
6.332
-1.304
-17.07%
1 jan 2008 ano
6.296
-0.036
-0.57%
1 jan 2009 ano
3.841
-2.455
-39.0%
1 jan 2010 ano
-7.693
-11.534
-300.3%
1 jan 2011 ano
2.973
+10.666
-138.64%
1 jan 2012 ano
4.159
+1.186
39.91%
1 jan 2013 ano
1.94
-2.219
-53.36%
1 jan 2014 ano
1.909
-0.031
-1.6%
1 jan 2015 ano
0.218
-1.691
-88.61%
1 jan 2016 ano
3.181
+2.964
1.36 mil%
Classificação de países por estatísticas atuais por anos


Comentários: