29
/pt/
pt
AIzaSyAYiBZKx7MnpbEhh9jyipgxe19OcubqV5w
April 1, 2024
133282
Finland
FIN
true
2
1
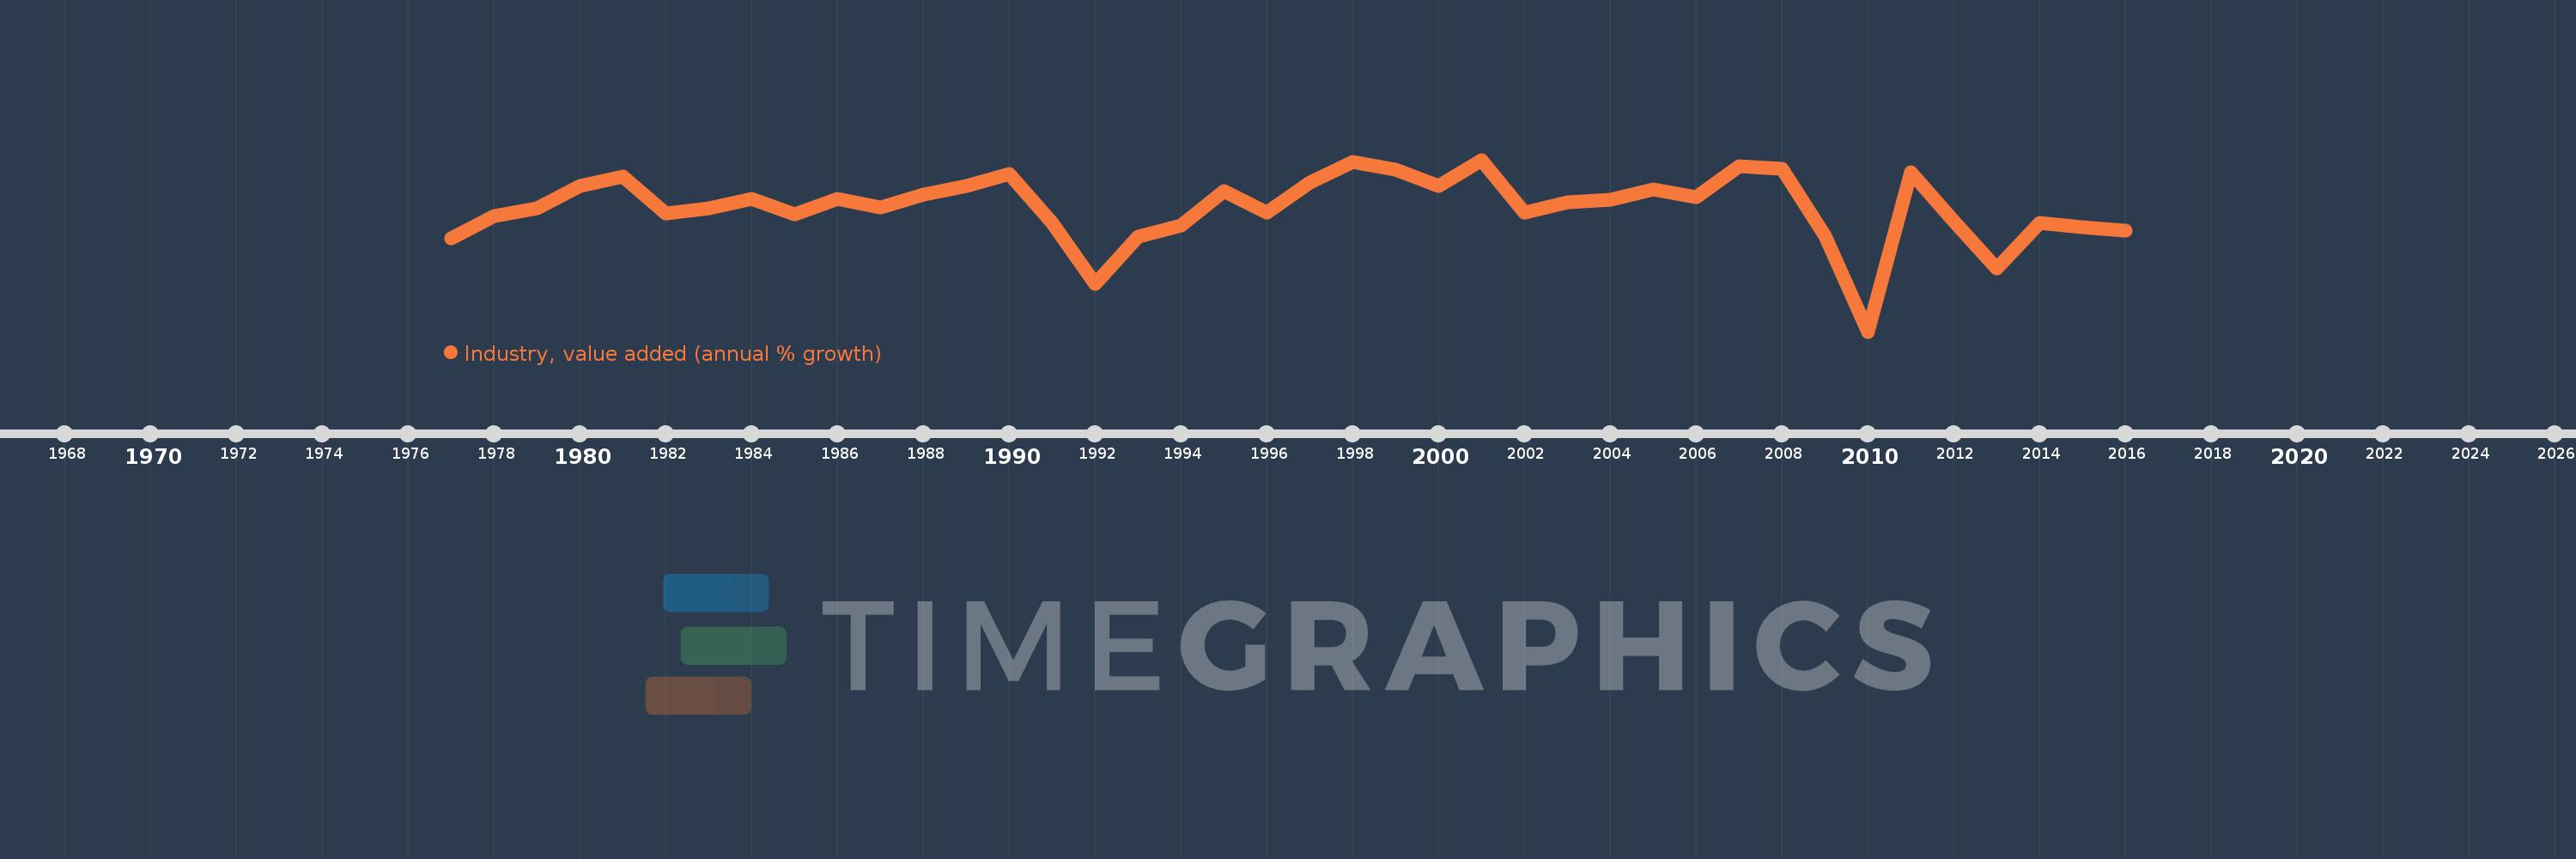
Industry, value added (annual % growth)
2016,2015,2014,2013,2012,2011,2010,2009,2008,2007,2006,2005,2004,2003,2002,2001,2000,1999,1998,1997,1996,1995,1994,1993,1992,1991,1990,1989,1988,1987,1986,1985,1984,1983,1982,1981,1980,1979,1978,1977
Estas estatísticas em outros países:
AfghanistanAlbaniaAlgeriaAntigua and BarbudaArab WorldArgentinaArmeniaAustraliaAustriaAzerbaijanBahamas, TheBahrainBangladeshBelarusBelgiumBelizeBeninBermudaBhutanBoliviaBosnia and HerzegovinaBotswanaBrazilBrunei DarussalamBulgariaBurkina FasoBurundiCabo VerdeCambodiaCameroonCanadaCaribbean small statesCayman IslandsCentral African RepublicCentral Europe and the BalticsChadChileChinaColombiaComorosCongo, Dem. Rep.Congo, Rep.Costa RicaCote d'IvoireCroatiaCubaCyprusCzech RepublicDenmarkDjiboutiDominicaDominican RepublicEarly-demographic dividendEast Asia & PacificEast Asia & Pacific (excluding high income)East Asia & Pacific (IDA & IBRD countries)EcuadorEgypt, Arab Rep.El SalvadorEquatorial GuineaEritreaEstoniaEthiopiaEuro areaEurope & Central AsiaEurope & Central Asia (excluding high income)Europe & Central Asia (IDA & IBRD countries)European UnionFijiFinlandFragile and conflict affected situationsFranceGabonGambia, TheGeorgiaGermanyGhanaGreeceGrenadaGuatemalaGuineaGuinea-BissauGuyanaHaitiHeavily indebted poor countries (HIPC)High incomeHondurasHong Kong SAR, ChinaHungaryIBRD onlyIcelandIDA & IBRD totalIDA blendIDA onlyIDA totalIndiaIndonesiaIran, Islamic Rep.IraqIrelandItalyJamaicaJapanJordanKazakhstanKenyaKiribatiKorea, Rep.KosovoKuwaitKyrgyz RepublicLao PDRLate-demographic dividendLatin America & Caribbean Latin America & Caribbean (excluding high income)Latin America & the Caribbean (IDA & IBRD countries)LatviaLeast developed countries: UN classificationLebanonLesothoLiberiaLithuaniaLow & middle incomeLow incomeLower middle incomeLuxembourgMacedonia, FYRMadagascarMalawiMalaysiaMaldivesMaliMarshall IslandsMauritaniaMauritiusMexicoMicronesia, Fed. Sts.Middle East & North AfricaMiddle East & North Africa (excluding high income)Middle East & North Africa (IDA & IBRD countries)Middle incomeMoldovaMongoliaMontenegroMoroccoMozambiqueMyanmarNamibiaNepalNetherlandsNew ZealandNicaraguaNigerNigeriaNorth AmericaNorwayOECD membersOmanOther small statesPacific island small statesPakistanPalauPanamaPapua New GuineaParaguayPeruPhilippinesPolandPortugalPost-demographic dividendPre-demographic dividendPuerto RicoQatarRomaniaRussian FederationRwandaSamoaSao Tome and PrincipeSaudi ArabiaSenegalSerbiaSeychellesSierra LeoneSingaporeSlovak RepublicSloveniaSmall statesSolomon IslandsSomaliaSouth AfricaSouth AsiaSouth Asia (IDA & IBRD)SpainSri LankaSt. Kitts and NevisSt. LuciaSt. Vincent and the GrenadinesSub-Saharan Africa Sub-Saharan Africa (excluding high income)Sub-Saharan Africa (IDA & IBRD countries)SudanSurinameSwazilandSwedenSwitzerlandSyrian Arab RepublicTajikistanTanzaniaThailandTimor-LesteTogoTongaTrinidad and TobagoTunisiaTurkeyTurkmenistanTuvaluUgandaUkraineUnited Arab EmiratesUnited KingdomUnited StatesUpper middle incomeUruguayUzbekistanVanuatuVenezuela, RBVietnamWest Bank and GazaWorldZambiaZimbabwe Linha do tempo:
Nesta escala de tempo está apresentado um gráfico de 1977 ano até 2016 ano Finland. Dados de 1976 ano ausente. O número de observações reais por data: 40.
Fonte (nome):
Indicadores de desenvolvimento mundial
Fonte (organização):
World Bank national accounts data, and OECD National Accounts data files.
Categorias:
Economy & Growth
Foi atualizado:
23 abr 2017 ano
Indicadores de alterações dos valores ao longo dos anos
Mínimo:
-18.126
1 jan 2010 ano
Máximo:
9.796
1 jan 2001 ano
Na data de observação
Valor
Mudança absoluta
A alteração em relação ao valor anterior
1 jan 1977 ano
-2.988
-2.988
0.0%
1 jan 1978 ano
0.689
+3.677
-123.06%
1 jan 1979 ano
1.944
+1.255
182.14%
1 jan 1980 ano
5.518
+3.574
183.84%
1 jan 1981 ano
7.077
+1.56
28.26%
1 jan 1982 ano
1.083
-5.994
-84.69%
1 jan 1983 ano
1.854
+0.771
71.16%
1 jan 1984 ano
3.479
+1.624
87.58%
1 jan 1985 ano
0.896
-2.583
-74.25%
1 jan 1986 ano
3.376
+2.48
276.8%
1 jan 1987 ano
2.016
-1.36
-40.29%
1 jan 1988 ano
4.164
+2.149
106.58%
1 jan 1989 ano
5.512
+1.348
32.37%
1 jan 1990 ano
7.526
+2.014
36.53%
1 jan 1991 ano
-0.494
-8.02
-106.57%
1 jan 1992 ano
-10.421
-9.926
2.01 mil%
1 jan 1993 ano
-2.689
+7.731
-74.19%
1 jan 1994 ano
-0.873
+1.816
-67.53%
1 jan 1995 ano
4.699
+5.572
-638.17%
1 jan 1996 ano
1.23
-3.469
-73.83%
1 jan 1997 ano
6.043
+4.813
391.35%
1 jan 1998 ano
9.438
+3.395
56.18%
1 jan 1999 ano
8.184
-1.254
-13.29%
1 jan 2000 ano
5.576
-2.608
-31.86%
1 jan 2001 ano
9.796
+4.219
75.67%
1 jan 2002 ano
1.27
-8.525
-87.03%
1 jan 2003 ano
2.839
+1.568
123.45%
1 jan 2004 ano
3.281
+0.442
15.57%
1 jan 2005 ano
4.934
+1.653
50.38%
1 jan 2006 ano
3.745
-1.188
-24.08%
1 jan 2007 ano
8.797
+5.052
134.88%
1 jan 2008 ano
8.392
-0.406
-4.61%
1 jan 2009 ano
-2.588
-10.98
-130.84%
1 jan 2010 ano
-18.126
-15.538
600.32%
1 jan 2011 ano
7.756
+25.882
-142.79%
1 jan 2012 ano
-0.196
-7.952
-102.52%
1 jan 2013 ano
-7.796
-7.6
3.88 mil%
1 jan 2014 ano
-0.468
+7.329
-94.0%
1 jan 2015 ano
-1.209
-0.741
158.55%
1 jan 2016 ano
-1.76
-0.551
45.59%
Classificação de países por estatísticas atuais por anos


Comentários: