29
/pt/
pt
AIzaSyAYiBZKx7MnpbEhh9jyipgxe19OcubqV5w
April 1, 2024
147971
Guyana
GUY
true
2
1
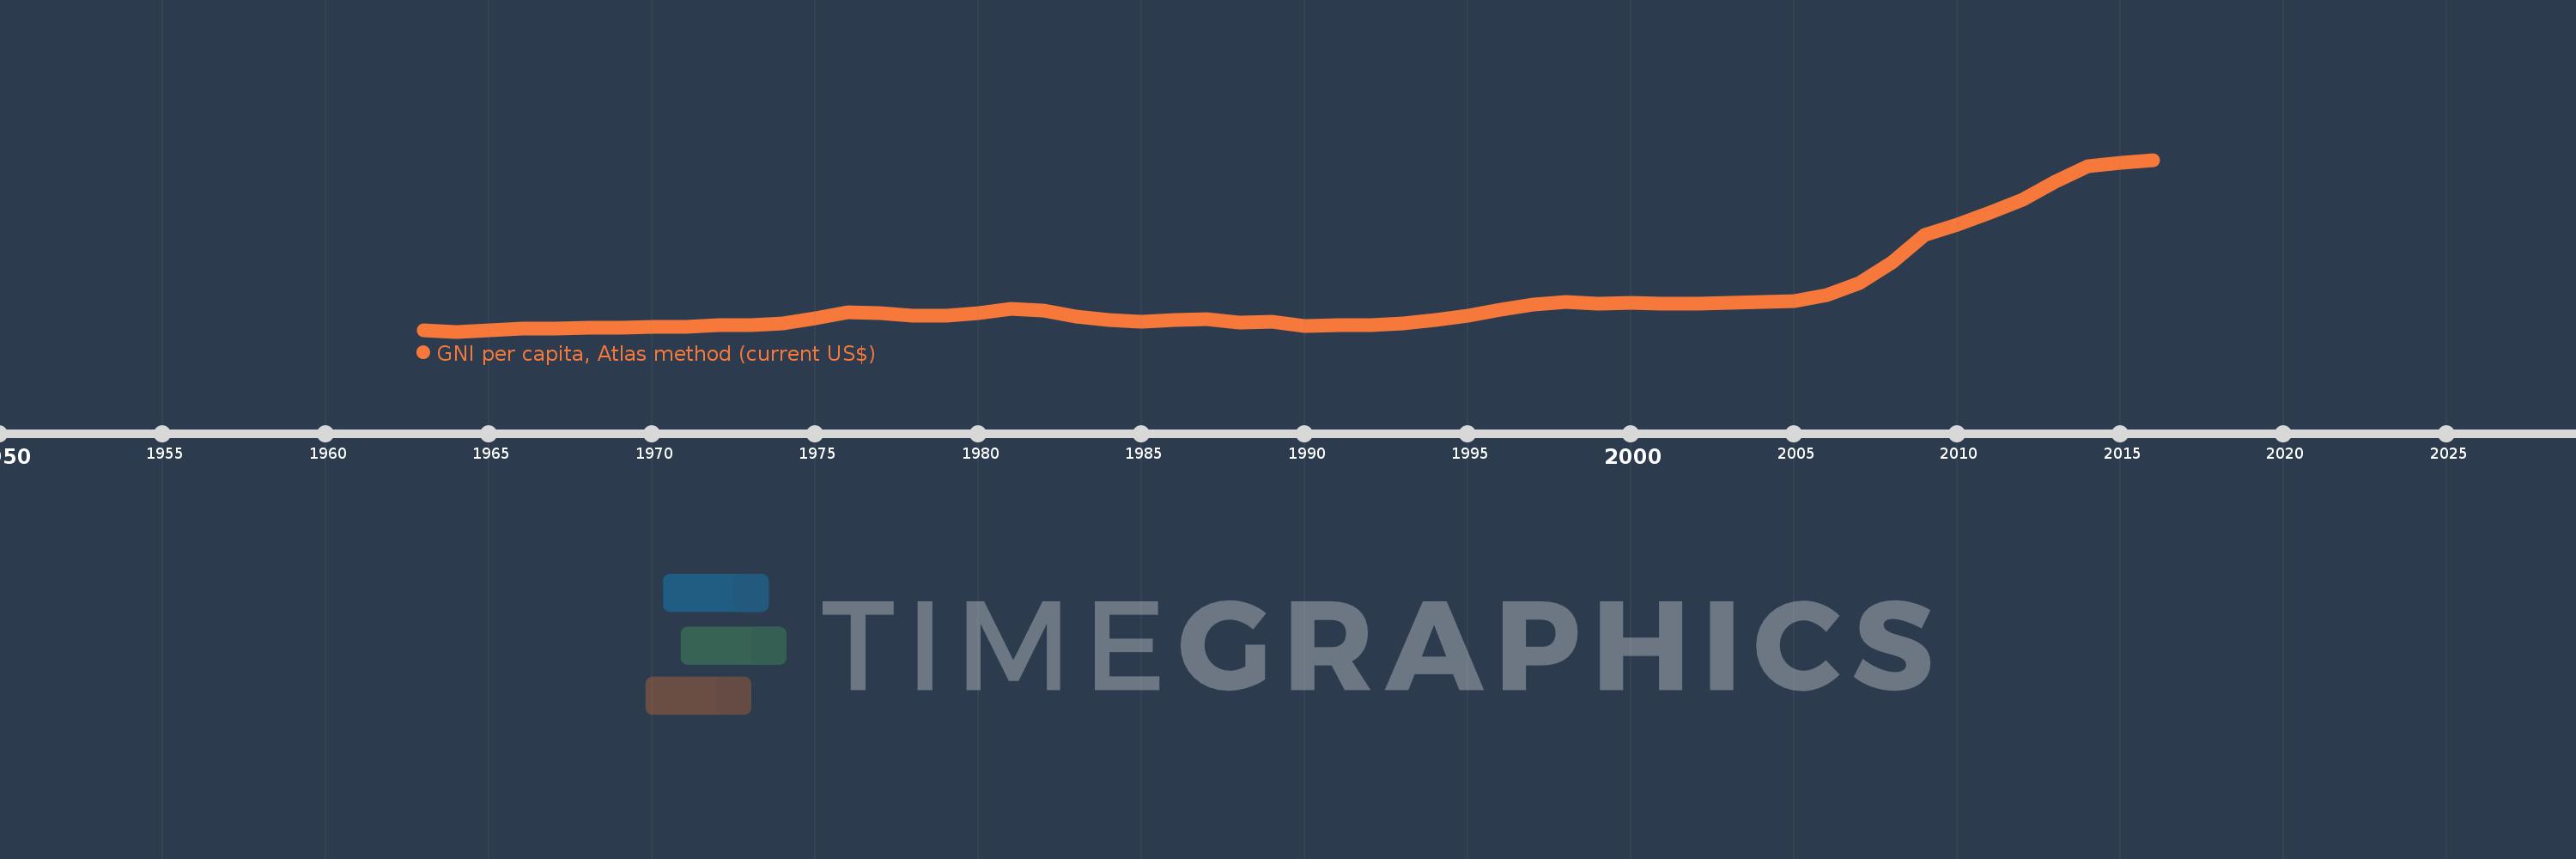
GNI per capita, Atlas method (current US$)
2016,2015,2014,2013,2012,2011,2010,2009,2008,2007,2006,2005,2004,2003,2002,2001,2000,1999,1998,1997,1996,1995,1994,1993,1992,1991,1990,1989,1988,1987,1986,1985,1984,1983,1982,1981,1980,1979,1978,1977,1976,1975,1974,1973,1972,1971,1970,1969,1968,1967,1966,1965,1964,1963
Estas estatísticas em outros países:
AfghanistanAlbaniaAlgeriaAndorraAngolaAntigua and BarbudaArab WorldArgentinaArmeniaAustraliaAustriaAzerbaijanBahamas, TheBahrainBangladeshBarbadosBelarusBelgiumBelizeBeninBermudaBhutanBoliviaBosnia and HerzegovinaBotswanaBrazilBrunei DarussalamBulgariaBurkina FasoBurundiCabo VerdeCambodiaCameroonCanadaCaribbean small statesCentral African RepublicCentral Europe and the BalticsChadChannel IslandsChileChinaColombiaComorosCongo, Dem. Rep.Congo, Rep.Costa RicaCote d'IvoireCroatiaCubaCyprusCzech RepublicDenmarkDjiboutiDominicaDominican RepublicEarly-demographic dividendEast Asia & PacificEast Asia & Pacific (excluding high income)East Asia & Pacific (IDA & IBRD countries)EcuadorEgypt, Arab Rep.El SalvadorEquatorial GuineaEritreaEstoniaEthiopiaEuro areaEurope & Central AsiaEurope & Central Asia (excluding high income)Europe & Central Asia (IDA & IBRD countries)European UnionFijiFinlandFragile and conflict affected situationsFranceFrench PolynesiaGabonGambia, TheGeorgiaGermanyGhanaGreeceGreenlandGrenadaGuatemalaGuineaGuinea-BissauGuyanaHaitiHeavily indebted poor countries (HIPC)High incomeHondurasHong Kong SAR, ChinaHungaryIBRD onlyIcelandIDA & IBRD totalIDA blendIDA onlyIDA totalIndiaIndonesiaIran, Islamic Rep.IraqIrelandIsle of ManIsraelItalyJamaicaJapanJordanKazakhstanKenyaKiribatiKorea, Rep.KosovoKuwaitKyrgyz RepublicLao PDRLate-demographic dividendLatin America & Caribbean Latin America & Caribbean (excluding high income)Latin America & the Caribbean (IDA & IBRD countries)LatviaLeast developed countries: UN classificationLebanonLesothoLiberiaLibyaLiechtensteinLithuaniaLow & middle incomeLow incomeLower middle incomeLuxembourgMacao SAR, ChinaMacedonia, FYRMadagascarMalawiMalaysiaMaldivesMaliMaltaMarshall IslandsMauritaniaMauritiusMexicoMicronesia, Fed. Sts.Middle East & North AfricaMiddle East & North Africa (excluding high income)Middle East & North Africa (IDA & IBRD countries)Middle incomeMoldovaMonacoMongoliaMontenegroMoroccoMozambiqueMyanmarNamibiaNauruNepalNetherlandsNew CaledoniaNew ZealandNicaraguaNigerNigeriaNorth AmericaNorwayOECD membersOmanOther small statesPacific island small statesPakistanPalauPanamaPapua New GuineaParaguayPeruPhilippinesPolandPortugalPost-demographic dividendPre-demographic dividendPuerto RicoQatarRomaniaRussian FederationRwandaSamoaSan MarinoSao Tome and PrincipeSaudi ArabiaSenegalSerbiaSeychellesSierra LeoneSingaporeSlovak RepublicSloveniaSmall statesSolomon IslandsSouth AfricaSouth AsiaSouth Asia (IDA & IBRD)South SudanSpainSri LankaSt. Kitts and NevisSt. LuciaSt. Vincent and the GrenadinesSub-Saharan Africa Sub-Saharan Africa (excluding high income)Sub-Saharan Africa (IDA & IBRD countries)SudanSurinameSwazilandSwedenSwitzerlandSyrian Arab RepublicTajikistanTanzaniaThailandTimor-LesteTogoTongaTrinidad and TobagoTunisiaTurkeyTurkmenistanTuvaluUgandaUkraineUnited Arab EmiratesUnited KingdomUnited StatesUpper middle incomeUruguayUzbekistanVanuatuVenezuela, RBVietnamVirgin Islands (U.S.)West Bank and GazaWorldYemen, Rep.ZambiaZimbabwe Linha do tempo:
Nesta escala de tempo está apresentado um gráfico de 1963 ano até 2016 ano Guyana. Dados de 1962 ano ausente. O número de observações reais por data: 54.
Fonte (nome):
Indicadores de desenvolvimento mundial
Fonte (organização):
World Bank national accounts data, and OECD National Accounts data files.
Categorias:
Economy & Growth
Foi atualizado:
23 abr 2017 ano
Indicadores de alterações dos valores ao longo dos anos
Mínimo:
250.0
1 jan 1964 ano
Máximo:
4.09 mil
1 jan 2016 ano
Na data de observação
Valor
Mudança absoluta
A alteração em relação ao valor anterior
1 jan 1963 ano
280.0
+280.0
0.0%
1 jan 1964 ano
250.0
-30.0
-10.71%
1 jan 1965 ano
280.0
+30.0
12.0%
1 jan 1966 ano
310.0
+30.0
10.71%
1 jan 1967 ano
320.0
+10.0
3.23%
1 jan 1968 ano
340.0
+20.0
6.25%
1 jan 1969 ano
340.0
0.0
0.0%
1 jan 1970 ano
360.0
+20.0
5.88%
1 jan 1971 ano
360.0
0.0
0.0%
1 jan 1972 ano
390.0
+30.0
8.33%
1 jan 1973 ano
400.0
+10.0
2.56%
1 jan 1974 ano
430.0
+30.0
7.5%
1 jan 1975 ano
550.0
+120.0
27.91%
1 jan 1976 ano
680.0
+130.0
23.64%
1 jan 1977 ano
670.0
-10.0
-1.47%
1 jan 1978 ano
610.0
-60.0
-8.96%
1 jan 1979 ano
610.0
0.0
0.0%
1 jan 1980 ano
660.0
+50.0
8.2%
1 jan 1981 ano
750.0
+90.0
13.64%
1 jan 1982 ano
730.0
-20.0
-2.67%
1 jan 1983 ano
580.0
-150.0
-20.55%
1 jan 1984 ano
510.0
-70.0
-12.07%
1 jan 1985 ano
470.0
-40.0
-7.84%
1 jan 1986 ano
510.0
+40.0
8.51%
1 jan 1987 ano
530.0
+20.0
3.92%
1 jan 1988 ano
460.0
-70.0
-13.21%
1 jan 1989 ano
480.0
+20.0
4.35%
1 jan 1990 ano
370.0
-110.0
-22.92%
1 jan 1991 ano
390.0
+20.0
5.41%
1 jan 1992 ano
390.0
0.0
0.0%
1 jan 1993 ano
440.0
+50.0
12.82%
1 jan 1994 ano
500.0
+60.0
13.64%
1 jan 1995 ano
610.0
+110.0
22.0%
1 jan 1996 ano
740.0
+130.0
21.31%
1 jan 1997 ano
860.0
+120.0
16.22%
1 jan 1998 ano
910.0
+50.0
5.81%
1 jan 1999 ano
880.0
-30.0
-3.3%
1 jan 2000 ano
890.0
+10.0
1.14%
1 jan 2001 ano
880.0
-10.0
-1.12%
1 jan 2002 ano
870.0
-10.0
-1.14%
1 jan 2003 ano
890.0
+20.0
2.3%
1 jan 2004 ano
920.0
+30.0
3.37%
1 jan 2005 ano
940.0
+20.0
2.17%
1 jan 2006 ano
1.06 mil
+120.0
12.77%
1 jan 2007 ano
1.34 mil
+280.0
26.42%
1 jan 2008 ano
1.79 mil
+450.0
33.58%
1 jan 2009 ano
2.41 mil
+620.0
34.64%
1 jan 2010 ano
2.65 mil
+240.0
9.96%
1 jan 2011 ano
2.9 mil
+250.0
9.43%
1 jan 2012 ano
3.19 mil
+290.0
10.0%
1 jan 2013 ano
3.6 mil
+410.0
12.85%
1 jan 2014 ano
3.94 mil
+340.0
9.44%
1 jan 2015 ano
4.03 mil
+90.0
2.28%
1 jan 2016 ano
4.09 mil
+60.0
1.49%
Classificação de países por estatísticas atuais por anos


Comentários: