29
/it/
it
AIzaSyAYiBZKx7MnpbEhh9jyipgxe19OcubqV5w
April 1, 2024
147971
Guyana
GUY
true
2
1
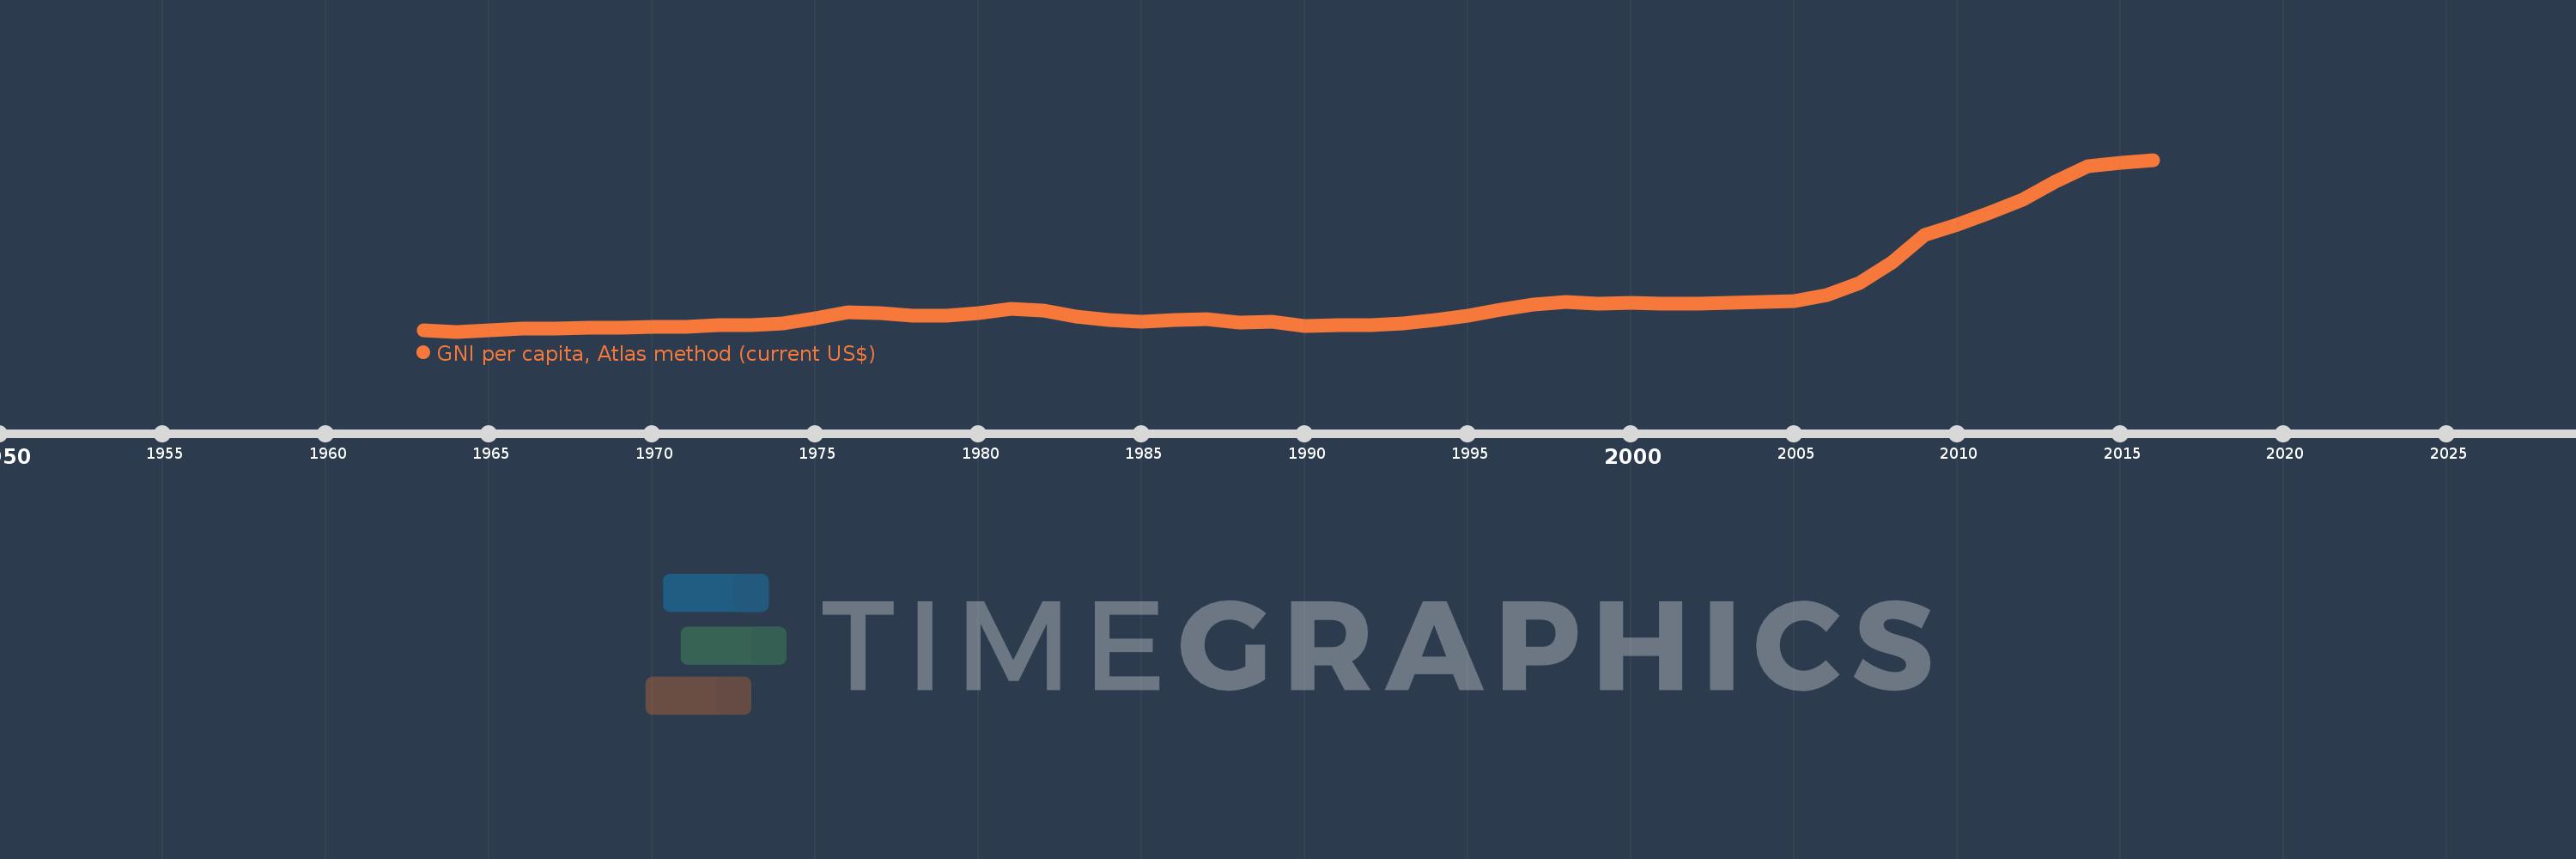
GNI per capita, Atlas method (current US$)
2016,2015,2014,2013,2012,2011,2010,2009,2008,2007,2006,2005,2004,2003,2002,2001,2000,1999,1998,1997,1996,1995,1994,1993,1992,1991,1990,1989,1988,1987,1986,1985,1984,1983,1982,1981,1980,1979,1978,1977,1976,1975,1974,1973,1972,1971,1970,1969,1968,1967,1966,1965,1964,1963
Queste statistiche in altri paesi:
AfghanistanAlbaniaAlgeriaAndorraAngolaAntigua and BarbudaArab WorldArgentinaArmeniaAustraliaAustriaAzerbaijanBahamas, TheBahrainBangladeshBarbadosBelarusBelgiumBelizeBeninBermudaBhutanBoliviaBosnia and HerzegovinaBotswanaBrazilBrunei DarussalamBulgariaBurkina FasoBurundiCabo VerdeCambodiaCameroonCanadaCaribbean small statesCentral African RepublicCentral Europe and the BalticsChadChannel IslandsChileChinaColombiaComorosCongo, Dem. Rep.Congo, Rep.Costa RicaCote d'IvoireCroatiaCubaCyprusCzech RepublicDenmarkDjiboutiDominicaDominican RepublicEarly-demographic dividendEast Asia & PacificEast Asia & Pacific (excluding high income)East Asia & Pacific (IDA & IBRD countries)EcuadorEgypt, Arab Rep.El SalvadorEquatorial GuineaEritreaEstoniaEthiopiaEuro areaEurope & Central AsiaEurope & Central Asia (excluding high income)Europe & Central Asia (IDA & IBRD countries)European UnionFijiFinlandFragile and conflict affected situationsFranceFrench PolynesiaGabonGambia, TheGeorgiaGermanyGhanaGreeceGreenlandGrenadaGuatemalaGuineaGuinea-BissauGuyanaHaitiHeavily indebted poor countries (HIPC)High incomeHondurasHong Kong SAR, ChinaHungaryIBRD onlyIcelandIDA & IBRD totalIDA blendIDA onlyIDA totalIndiaIndonesiaIran, Islamic Rep.IraqIrelandIsle of ManIsraelItalyJamaicaJapanJordanKazakhstanKenyaKiribatiKorea, Rep.KosovoKuwaitKyrgyz RepublicLao PDRLate-demographic dividendLatin America & Caribbean Latin America & Caribbean (excluding high income)Latin America & the Caribbean (IDA & IBRD countries)LatviaLeast developed countries: UN classificationLebanonLesothoLiberiaLibyaLiechtensteinLithuaniaLow & middle incomeLow incomeLower middle incomeLuxembourgMacao SAR, ChinaMacedonia, FYRMadagascarMalawiMalaysiaMaldivesMaliMaltaMarshall IslandsMauritaniaMauritiusMexicoMicronesia, Fed. Sts.Middle East & North AfricaMiddle East & North Africa (excluding high income)Middle East & North Africa (IDA & IBRD countries)Middle incomeMoldovaMonacoMongoliaMontenegroMoroccoMozambiqueMyanmarNamibiaNauruNepalNetherlandsNew CaledoniaNew ZealandNicaraguaNigerNigeriaNorth AmericaNorwayOECD membersOmanOther small statesPacific island small statesPakistanPalauPanamaPapua New GuineaParaguayPeruPhilippinesPolandPortugalPost-demographic dividendPre-demographic dividendPuerto RicoQatarRomaniaRussian FederationRwandaSamoaSan MarinoSao Tome and PrincipeSaudi ArabiaSenegalSerbiaSeychellesSierra LeoneSingaporeSlovak RepublicSloveniaSmall statesSolomon IslandsSouth AfricaSouth AsiaSouth Asia (IDA & IBRD)South SudanSpainSri LankaSt. Kitts and NevisSt. LuciaSt. Vincent and the GrenadinesSub-Saharan Africa Sub-Saharan Africa (excluding high income)Sub-Saharan Africa (IDA & IBRD countries)SudanSurinameSwazilandSwedenSwitzerlandSyrian Arab RepublicTajikistanTanzaniaThailandTimor-LesteTogoTongaTrinidad and TobagoTunisiaTurkeyTurkmenistanTuvaluUgandaUkraineUnited Arab EmiratesUnited KingdomUnited StatesUpper middle incomeUruguayUzbekistanVanuatuVenezuela, RBVietnamVirgin Islands (U.S.)West Bank and GazaWorldYemen, Rep.ZambiaZimbabwe Linea del tempo:
Questa scala temporale mostra un grafico dal 1963 anno al 2016 anno. Guyana. I dati fino ad 1962 anno non disponibili. Il numero di osservazioni attuali secondo i date: 54.
La fonte (nome):
Indicatori dello sviluppo mondiale
La fonte (organizzazione):
World Bank national accounts data, and OECD National Accounts data files.
Categorie:
Economy & Growth
sono stati aggiornati
23 apr 2017 anni
Indicatori delle variazioni dei valori per anni
Minima:
250.0
1 gen 1964 anni
Massimo:
4.09 Mille.
1 gen 2016 anni
Alla data di osservazione
Valore
Variazione assoluta
La variazione rispetto al valore precedente
1 gen 1963 anni
280.0
+280.0
0.0%
1 gen 1964 anni
250.0
-30.0
-10.71%
1 gen 1965 anni
280.0
+30.0
12.0%
1 gen 1966 anni
310.0
+30.0
10.71%
1 gen 1967 anni
320.0
+10.0
3.23%
1 gen 1968 anni
340.0
+20.0
6.25%
1 gen 1969 anni
340.0
0.0
0.0%
1 gen 1970 anni
360.0
+20.0
5.88%
1 gen 1971 anni
360.0
0.0
0.0%
1 gen 1972 anni
390.0
+30.0
8.33%
1 gen 1973 anni
400.0
+10.0
2.56%
1 gen 1974 anni
430.0
+30.0
7.5%
1 gen 1975 anni
550.0
+120.0
27.91%
1 gen 1976 anni
680.0
+130.0
23.64%
1 gen 1977 anni
670.0
-10.0
-1.47%
1 gen 1978 anni
610.0
-60.0
-8.96%
1 gen 1979 anni
610.0
0.0
0.0%
1 gen 1980 anni
660.0
+50.0
8.2%
1 gen 1981 anni
750.0
+90.0
13.64%
1 gen 1982 anni
730.0
-20.0
-2.67%
1 gen 1983 anni
580.0
-150.0
-20.55%
1 gen 1984 anni
510.0
-70.0
-12.07%
1 gen 1985 anni
470.0
-40.0
-7.84%
1 gen 1986 anni
510.0
+40.0
8.51%
1 gen 1987 anni
530.0
+20.0
3.92%
1 gen 1988 anni
460.0
-70.0
-13.21%
1 gen 1989 anni
480.0
+20.0
4.35%
1 gen 1990 anni
370.0
-110.0
-22.92%
1 gen 1991 anni
390.0
+20.0
5.41%
1 gen 1992 anni
390.0
0.0
0.0%
1 gen 1993 anni
440.0
+50.0
12.82%
1 gen 1994 anni
500.0
+60.0
13.64%
1 gen 1995 anni
610.0
+110.0
22.0%
1 gen 1996 anni
740.0
+130.0
21.31%
1 gen 1997 anni
860.0
+120.0
16.22%
1 gen 1998 anni
910.0
+50.0
5.81%
1 gen 1999 anni
880.0
-30.0
-3.3%
1 gen 2000 anni
890.0
+10.0
1.14%
1 gen 2001 anni
880.0
-10.0
-1.12%
1 gen 2002 anni
870.0
-10.0
-1.14%
1 gen 2003 anni
890.0
+20.0
2.3%
1 gen 2004 anni
920.0
+30.0
3.37%
1 gen 2005 anni
940.0
+20.0
2.17%
1 gen 2006 anni
1.06 Mille.
+120.0
12.77%
1 gen 2007 anni
1.34 Mille.
+280.0
26.42%
1 gen 2008 anni
1.79 Mille.
+450.0
33.58%
1 gen 2009 anni
2.41 Mille.
+620.0
34.64%
1 gen 2010 anni
2.65 Mille.
+240.0
9.96%
1 gen 2011 anni
2.9 Mille.
+250.0
9.43%
1 gen 2012 anni
3.19 Mille.
+290.0
10.0%
1 gen 2013 anni
3.6 Mille.
+410.0
12.85%
1 gen 2014 anni
3.94 Mille.
+340.0
9.44%
1 gen 2015 anni
4.03 Mille.
+90.0
2.28%
1 gen 2016 anni
4.09 Mille.
+60.0
1.49%
Classificazione dei paesi secondo i statistiche attuali per anni


Commenti: