29
/pt/
pt
AIzaSyAYiBZKx7MnpbEhh9jyipgxe19OcubqV5w
April 1, 2024
136408
Gambia, The
GMB
true
2
1
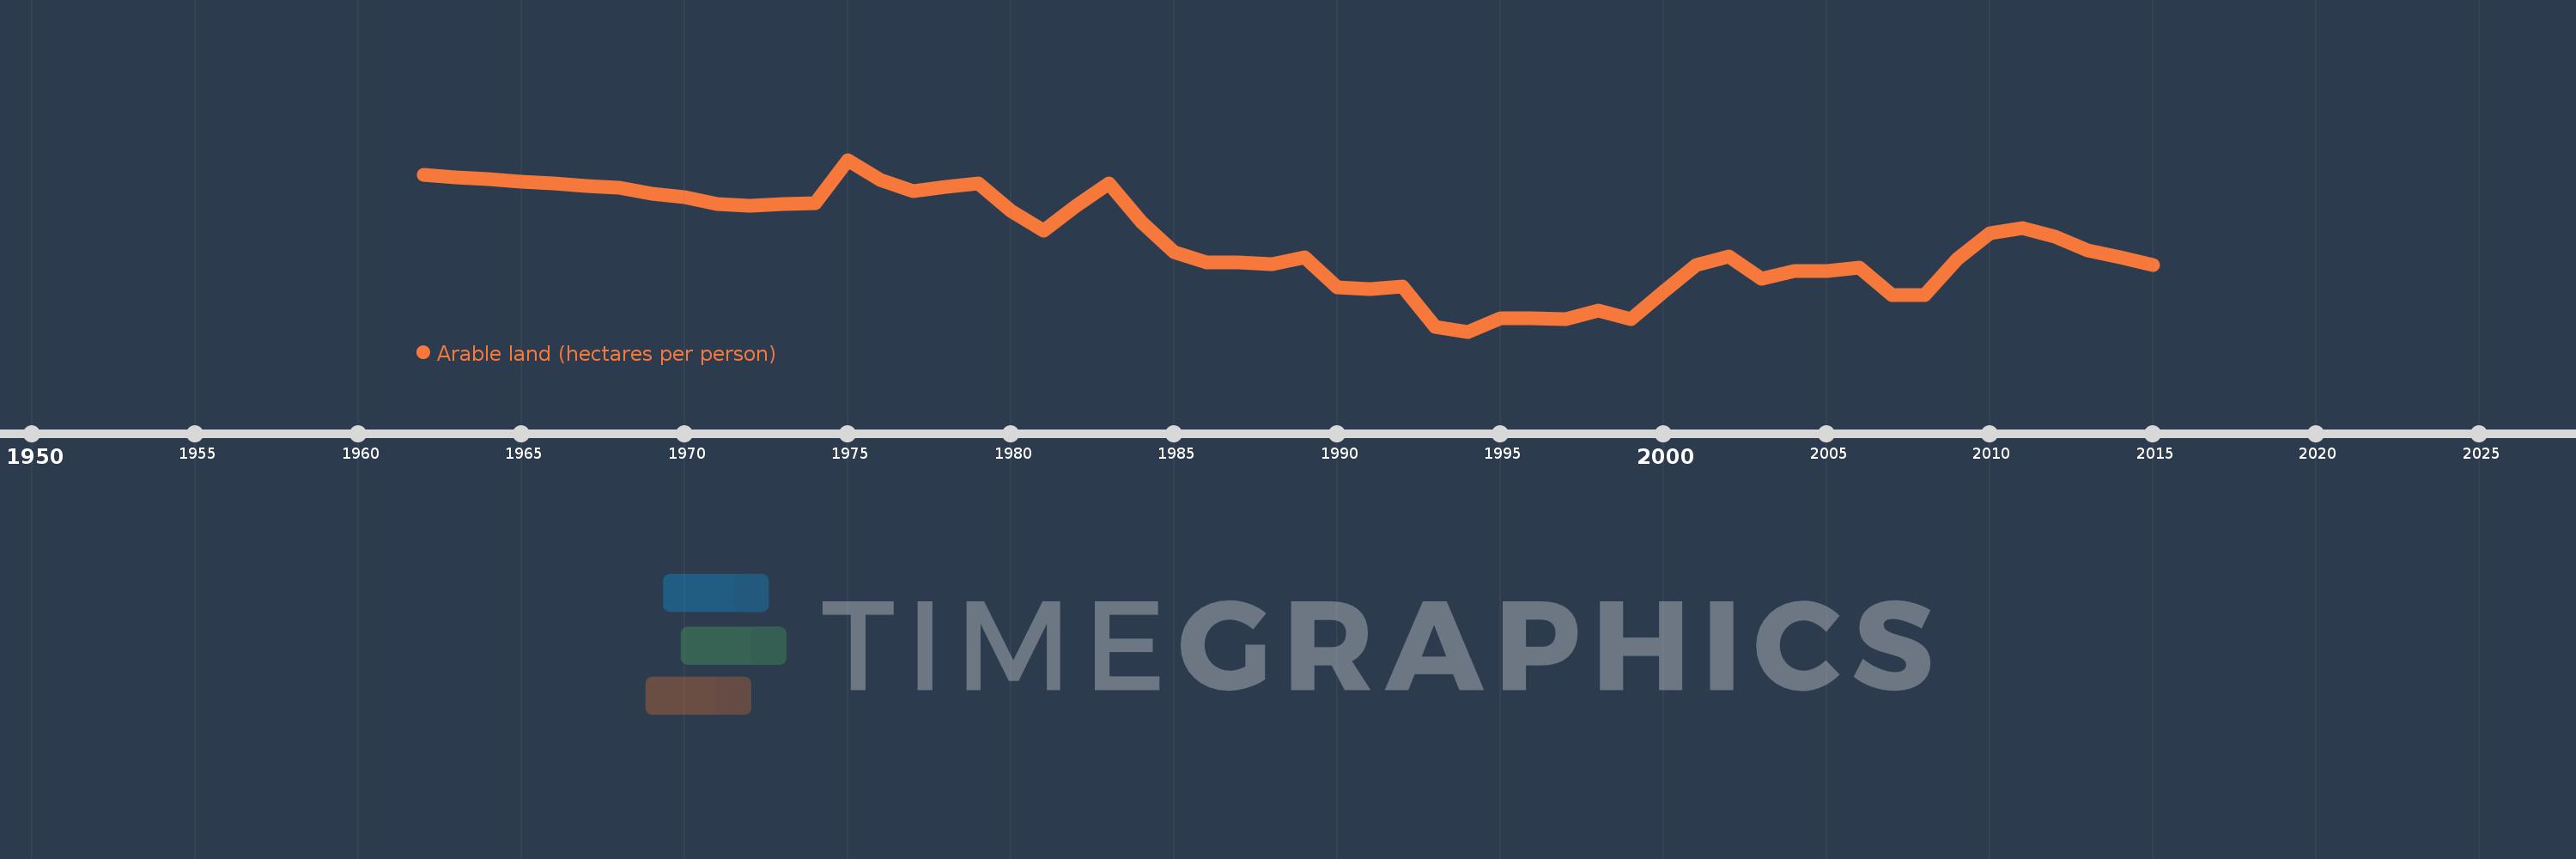
Arable land (hectares per person)
2015,2014,2013,2012,2011,2010,2009,2008,2007,2006,2005,2004,2003,2002,2001,2000,1999,1998,1997,1996,1995,1994,1993,1992,1991,1990,1989,1988,1987,1986,1985,1984,1983,1982,1981,1980,1979,1978,1977,1976,1975,1974,1973,1972,1971,1970,1969,1968,1967,1966,1965,1964,1963,1962
Estas estatísticas em outros países:
AfghanistanAlbaniaAlgeriaAmerican SamoaAndorraAngolaAntigua and BarbudaArab WorldArgentinaArmeniaArubaAustraliaAustriaAzerbaijanBahamas, TheBahrainBangladeshBarbadosBelarusBelgiumBelizeBeninBermudaBhutanBoliviaBosnia and HerzegovinaBotswanaBrazilBritish Virgin IslandsBrunei DarussalamBulgariaBurkina FasoBurundiCabo VerdeCambodiaCameroonCanadaCaribbean small statesCayman IslandsCentral African RepublicCentral Europe and the BalticsChadChannel IslandsChileChinaColombiaComorosCongo, Dem. Rep.Congo, Rep.Costa RicaCote d'IvoireCroatiaCubaCyprusCzech RepublicDenmarkDjiboutiDominicaDominican RepublicEarly-demographic dividendEast Asia & PacificEast Asia & Pacific (excluding high income)East Asia & Pacific (IDA & IBRD countries)EcuadorEgypt, Arab Rep.El SalvadorEquatorial GuineaEritreaEstoniaEthiopiaEuro areaEurope & Central AsiaEurope & Central Asia (excluding high income)Europe & Central Asia (IDA & IBRD countries)European UnionFaroe IslandsFijiFinlandFragile and conflict affected situationsFranceFrench PolynesiaGabonGambia, TheGeorgiaGermanyGhanaGreeceGreenlandGrenadaGuamGuatemalaGuineaGuinea-BissauGuyanaHaitiHeavily indebted poor countries (HIPC)High incomeHondurasHong Kong SAR, ChinaHungaryIBRD onlyIcelandIDA & IBRD totalIDA blendIDA onlyIDA totalIndiaIndonesiaIran, Islamic Rep.IraqIrelandIsle of ManIsraelItalyJamaicaJapanJordanKazakhstanKenyaKiribatiKorea, Dem. People’s Rep.Korea, Rep.KosovoKuwaitKyrgyz RepublicLao PDRLate-demographic dividendLatin America & Caribbean Latin America & Caribbean (excluding high income)Latin America & the Caribbean (IDA & IBRD countries)LatviaLeast developed countries: UN classificationLebanonLesothoLiberiaLibyaLiechtensteinLithuaniaLow & middle incomeLow incomeLower middle incomeLuxembourgMacedonia, FYRMadagascarMalawiMalaysiaMaldivesMaliMaltaMarshall IslandsMauritaniaMauritiusMexicoMicronesia, Fed. Sts.Middle East & North AfricaMiddle East & North Africa (excluding high income)Middle East & North Africa (IDA & IBRD countries)Middle incomeMoldovaMongoliaMontenegroMoroccoMozambiqueMyanmarNamibiaNepalNetherlandsNew CaledoniaNew ZealandNicaraguaNigerNigeriaNorth AmericaNorthern Mariana IslandsNorwayOECD membersOmanOther small statesPacific island small statesPakistanPalauPanamaPapua New GuineaParaguayPeruPhilippinesPolandPortugalPost-demographic dividendPre-demographic dividendPuerto RicoQatarRomaniaRussian FederationRwandaSamoaSan MarinoSao Tome and PrincipeSaudi ArabiaSenegalSerbiaSeychellesSierra LeoneSingaporeSlovak RepublicSloveniaSmall statesSolomon IslandsSomaliaSouth AfricaSouth AsiaSouth Asia (IDA & IBRD)SpainSri LankaSt. Kitts and NevisSt. LuciaSt. Vincent and the GrenadinesSub-Saharan Africa Sub-Saharan Africa (excluding high income)Sub-Saharan Africa (IDA & IBRD countries)SudanSurinameSwazilandSwedenSwitzerlandSyrian Arab RepublicTajikistanTanzaniaThailandTimor-LesteTogoTongaTrinidad and TobagoTunisiaTurkeyTurkmenistanTurks and Caicos IslandsUgandaUkraineUnited Arab EmiratesUnited KingdomUnited StatesUpper middle incomeUruguayUzbekistanVanuatuVenezuela, RBVietnamVirgin Islands (U.S.)West Bank and GazaWorldYemen, Rep.ZambiaZimbabwe Linha do tempo:
Nesta escala de tempo está apresentado um gráfico de 1962 ano até 2015 ano Gambia, The. Dados de 1961 ano ausente. O número de observações reais por data: 54.
Fonte (nome):
Indicadores de desenvolvimento mundial
Fonte (organização):
Food and Agriculture Organization, electronic files and web site.
Categorias:
Agriculture & Rural Development
Foi atualizado:
23 abr 2017 ano
Indicadores de alterações dos valores ao longo dos anos
Mínimo:
0.16
1 jan 1994 ano
Máximo:
0.336
1 jan 1975 ano
Na data de observação
Valor
Mudança absoluta
A alteração em relação ao valor anterior
1 jan 1962 ano
0.321
+0.321
0.0%
1 jan 1963 ano
0.318
-0.003
-0.96%
1 jan 1964 ano
0.316
-0.002
-0.62%
1 jan 1965 ano
0.314
-0.002
-0.59%
1 jan 1966 ano
0.312
-0.002
-0.78%
1 jan 1967 ano
0.309
-0.003
-1.01%
1 jan 1968 ano
0.307
-0.001
-0.4%
1 jan 1969 ano
0.301
-0.007
-2.15%
1 jan 1970 ano
0.298
-0.003
-0.84%
1 jan 1971 ano
0.291
-0.008
-2.57%
1 jan 1972 ano
0.289
-0.002
-0.56%
1 jan 1973 ano
0.291
+0.002
0.62%
1 jan 1974 ano
0.292
+0.001
0.38%
1 jan 1975 ano
0.336
+0.044
15.2%
1 jan 1976 ano
0.315
-0.022
-6.41%
1 jan 1977 ano
0.304
-0.011
-3.45%
1 jan 1978 ano
0.308
+0.004
1.38%
1 jan 1979 ano
0.312
+0.004
1.18%
1 jan 1980 ano
0.284
-0.028
-8.99%
1 jan 1981 ano
0.263
-0.021
-7.26%
1 jan 1982 ano
0.289
+0.026
10.01%
1 jan 1983 ano
0.312
+0.022
7.68%
1 jan 1984 ano
0.272
-0.04
-12.77%
1 jan 1985 ano
0.241
-0.031
-11.32%
1 jan 1986 ano
0.231
-0.01
-4.23%
1 jan 1987 ano
0.231
+0.0
0.02%
1 jan 1988 ano
0.229
-0.002
-0.9%
1 jan 1989 ano
0.236
+0.007
3.16%
1 jan 1990 ano
0.205
-0.031
-12.98%
1 jan 1991 ano
0.204
-0.001
-0.7%
1 jan 1992 ano
0.206
+0.002
1.21%
1 jan 1993 ano
0.165
-0.041
-19.9%
1 jan 1994 ano
0.16
-0.006
-3.44%
1 jan 1995 ano
0.174
+0.014
8.75%
1 jan 1996 ano
0.174
0.0
-0.03%
1 jan 1997 ano
0.173
0.0
-0.12%
1 jan 1998 ano
0.182
+0.009
4.93%
1 jan 1999 ano
0.173
-0.009
-5.15%
1 jan 2000 ano
0.201
+0.029
16.59%
1 jan 2001 ano
0.228
+0.027
13.25%
1 jan 2002 ano
0.237
+0.009
3.91%
1 jan 2003 ano
0.214
-0.023
-9.56%
1 jan 2004 ano
0.222
+0.008
3.76%
1 jan 2005 ano
0.222
+0.0
0.05%
1 jan 2006 ano
0.226
+0.003
1.5%
1 jan 2007 ano
0.197
-0.029
-12.71%
1 jan 2008 ano
0.197
+0.0
0.14%
1 jan 2009 ano
0.234
+0.037
18.88%
1 jan 2010 ano
0.261
+0.027
11.39%
1 jan 2011 ano
0.266
+0.005
1.78%
1 jan 2012 ano
0.257
-0.009
-3.21%
1 jan 2013 ano
0.243
-0.014
-5.36%
1 jan 2014 ano
0.236
-0.008
-3.2%
1 jan 2015 ano
0.228
-0.007
-3.18%
Classificação de países por estatísticas atuais por anos


Comentários: