29
/pt/
pt
AIzaSyAYiBZKx7MnpbEhh9jyipgxe19OcubqV5w
April 1, 2024
118661
Denmark
DNK
true
2
1
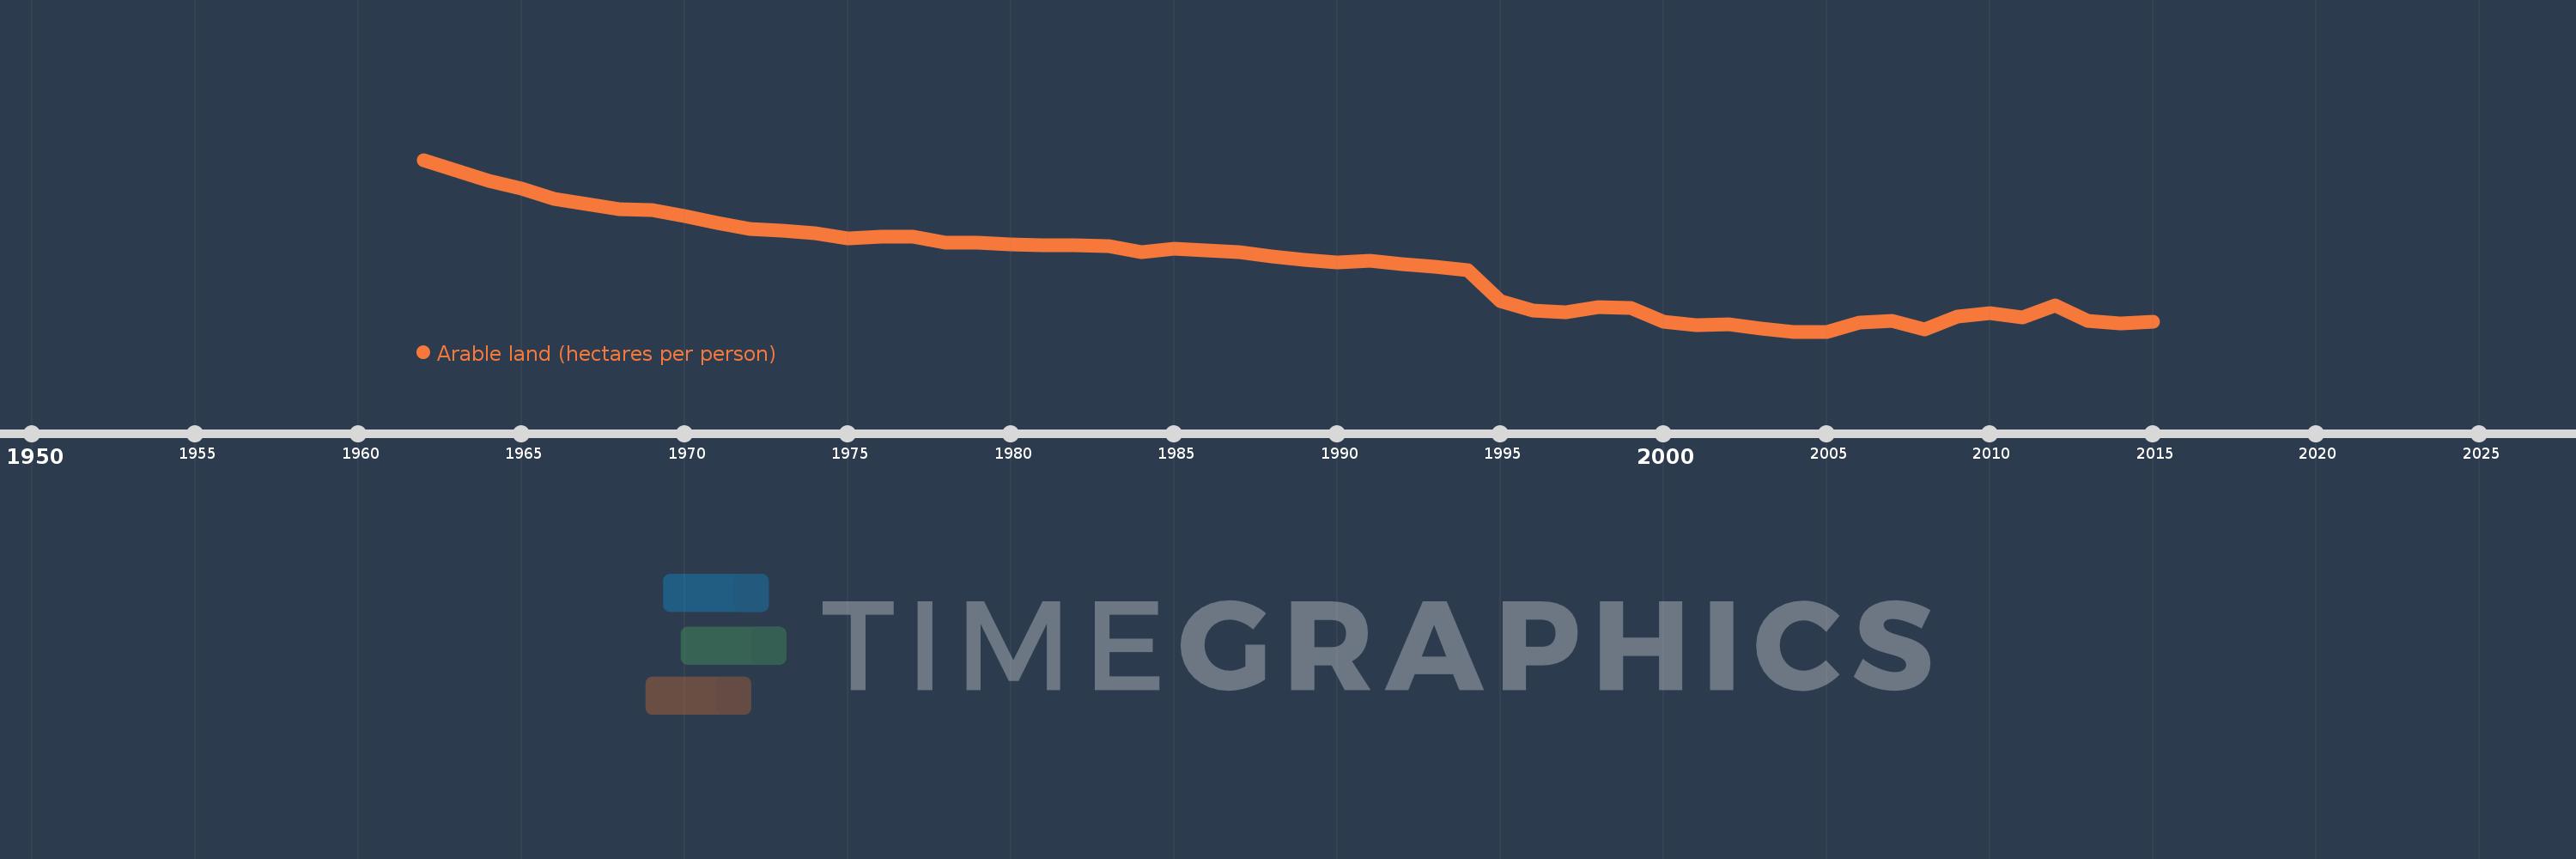
Arable land (hectares per person)
2015,2014,2013,2012,2011,2010,2009,2008,2007,2006,2005,2004,2003,2002,2001,2000,1999,1998,1997,1996,1995,1994,1993,1992,1991,1990,1989,1988,1987,1986,1985,1984,1983,1982,1981,1980,1979,1978,1977,1976,1975,1974,1973,1972,1971,1970,1969,1968,1967,1966,1965,1964,1963,1962
Estas estatísticas em outros países:
AfghanistanAlbaniaAlgeriaAmerican SamoaAndorraAngolaAntigua and BarbudaArab WorldArgentinaArmeniaArubaAustraliaAustriaAzerbaijanBahamas, TheBahrainBangladeshBarbadosBelarusBelgiumBelizeBeninBermudaBhutanBoliviaBosnia and HerzegovinaBotswanaBrazilBritish Virgin IslandsBrunei DarussalamBulgariaBurkina FasoBurundiCabo VerdeCambodiaCameroonCanadaCaribbean small statesCayman IslandsCentral African RepublicCentral Europe and the BalticsChadChannel IslandsChileChinaColombiaComorosCongo, Dem. Rep.Congo, Rep.Costa RicaCote d'IvoireCroatiaCubaCyprusCzech RepublicDenmarkDjiboutiDominicaDominican RepublicEarly-demographic dividendEast Asia & PacificEast Asia & Pacific (excluding high income)East Asia & Pacific (IDA & IBRD countries)EcuadorEgypt, Arab Rep.El SalvadorEquatorial GuineaEritreaEstoniaEthiopiaEuro areaEurope & Central AsiaEurope & Central Asia (excluding high income)Europe & Central Asia (IDA & IBRD countries)European UnionFaroe IslandsFijiFinlandFragile and conflict affected situationsFranceFrench PolynesiaGabonGambia, TheGeorgiaGermanyGhanaGreeceGreenlandGrenadaGuamGuatemalaGuineaGuinea-BissauGuyanaHaitiHeavily indebted poor countries (HIPC)High incomeHondurasHong Kong SAR, ChinaHungaryIBRD onlyIcelandIDA & IBRD totalIDA blendIDA onlyIDA totalIndiaIndonesiaIran, Islamic Rep.IraqIrelandIsle of ManIsraelItalyJamaicaJapanJordanKazakhstanKenyaKiribatiKorea, Dem. People’s Rep.Korea, Rep.KosovoKuwaitKyrgyz RepublicLao PDRLate-demographic dividendLatin America & Caribbean Latin America & Caribbean (excluding high income)Latin America & the Caribbean (IDA & IBRD countries)LatviaLeast developed countries: UN classificationLebanonLesothoLiberiaLibyaLiechtensteinLithuaniaLow & middle incomeLow incomeLower middle incomeLuxembourgMacedonia, FYRMadagascarMalawiMalaysiaMaldivesMaliMaltaMarshall IslandsMauritaniaMauritiusMexicoMicronesia, Fed. Sts.Middle East & North AfricaMiddle East & North Africa (excluding high income)Middle East & North Africa (IDA & IBRD countries)Middle incomeMoldovaMongoliaMontenegroMoroccoMozambiqueMyanmarNamibiaNepalNetherlandsNew CaledoniaNew ZealandNicaraguaNigerNigeriaNorth AmericaNorthern Mariana IslandsNorwayOECD membersOmanOther small statesPacific island small statesPakistanPalauPanamaPapua New GuineaParaguayPeruPhilippinesPolandPortugalPost-demographic dividendPre-demographic dividendPuerto RicoQatarRomaniaRussian FederationRwandaSamoaSan MarinoSao Tome and PrincipeSaudi ArabiaSenegalSerbiaSeychellesSierra LeoneSingaporeSlovak RepublicSloveniaSmall statesSolomon IslandsSomaliaSouth AfricaSouth AsiaSouth Asia (IDA & IBRD)SpainSri LankaSt. Kitts and NevisSt. LuciaSt. Vincent and the GrenadinesSub-Saharan Africa Sub-Saharan Africa (excluding high income)Sub-Saharan Africa (IDA & IBRD countries)SudanSurinameSwazilandSwedenSwitzerlandSyrian Arab RepublicTajikistanTanzaniaThailandTimor-LesteTogoTongaTrinidad and TobagoTunisiaTurkeyTurkmenistanTurks and Caicos IslandsUgandaUkraineUnited Arab EmiratesUnited KingdomUnited StatesUpper middle incomeUruguayUzbekistanVanuatuVenezuela, RBVietnamVirgin Islands (U.S.)West Bank and GazaWorldYemen, Rep.ZambiaZimbabwe Linha do tempo:
Nesta escala de tempo está apresentado um gráfico de 1962 ano até 2015 ano Denmark. Dados de 1961 ano ausente. O número de observações reais por data: 54.
Fonte (nome):
Indicadores de desenvolvimento mundial
Fonte (organização):
Food and Agriculture Organization, electronic files and web site.
Categorias:
Agriculture & Rural Development
Foi atualizado:
23 abr 2017 ano
Indicadores de alterações dos valores ao longo dos anos
Mínimo:
0.42
1 jan 2005 ano
Máximo:
0.609
1 jan 1962 ano
Na data de observação
Valor
Mudança absoluta
A alteração em relação ao valor anterior
1 jan 1962 ano
0.609
+0.609
0.0%
1 jan 1963 ano
0.597
-0.012
-1.98%
1 jan 1964 ano
0.586
-0.011
-1.82%
1 jan 1965 ano
0.577
-0.008
-1.45%
1 jan 1966 ano
0.566
-0.011
-1.98%
1 jan 1967 ano
0.56
-0.006
-1.06%
1 jan 1968 ano
0.555
-0.005
-0.82%
1 jan 1969 ano
0.554
-0.002
-0.27%
1 jan 1970 ano
0.547
-0.006
-1.14%
1 jan 1971 ano
0.54
-0.008
-1.38%
1 jan 1972 ano
0.533
-0.007
-1.21%
1 jan 1973 ano
0.531
-0.002
-0.42%
1 jan 1974 ano
0.528
-0.003
-0.53%
1 jan 1975 ano
0.523
-0.005
-0.91%
1 jan 1976 ano
0.524
+0.0
0.05%
1 jan 1977 ano
0.524
+0.0
0.01%
1 jan 1978 ano
0.518
-0.006
-1.06%
1 jan 1979 ano
0.518
0.0
-0.08%
1 jan 1980 ano
0.516
-0.001
-0.28%
1 jan 1981 ano
0.515
-0.001
-0.23%
1 jan 1982 ano
0.515
0.0
-0.05%
1 jan 1983 ano
0.514
-0.001
-0.19%
1 jan 1984 ano
0.507
-0.007
-1.34%
1 jan 1985 ano
0.511
+0.004
0.79%
1 jan 1986 ano
0.509
-0.002
-0.46%
1 jan 1987 ano
0.507
-0.002
-0.4%
1 jan 1988 ano
0.503
-0.004
-0.74%
1 jan 1989 ano
0.499
-0.004
-0.75%
1 jan 1990 ano
0.496
-0.003
-0.65%
1 jan 1991 ano
0.498
+0.002
0.47%
1 jan 1992 ano
0.494
-0.004
-0.77%
1 jan 1993 ano
0.491
-0.003
-0.68%
1 jan 1994 ano
0.488
-0.003
-0.57%
1 jan 1995 ano
0.454
-0.034
-6.95%
1 jan 1996 ano
0.443
-0.011
-2.45%
1 jan 1997 ano
0.441
-0.002
-0.44%
1 jan 1998 ano
0.447
+0.006
1.43%
1 jan 1999 ano
0.446
-0.001
-0.32%
1 jan 2000 ano
0.431
-0.015
-3.36%
1 jan 2001 ano
0.427
-0.004
-0.9%
1 jan 2002 ano
0.428
+0.001
0.12%
1 jan 2003 ano
0.423
-0.004
-1.01%
1 jan 2004 ano
0.42
-0.003
-0.71%
1 jan 2005 ano
0.42
-0.001
-0.13%
1 jan 2006 ano
0.43
+0.01
2.49%
1 jan 2007 ano
0.432
+0.001
0.31%
1 jan 2008 ano
0.422
-0.009
-2.18%
1 jan 2009 ano
0.437
+0.015
3.55%
1 jan 2010 ano
0.44
+0.003
0.67%
1 jan 2011 ano
0.436
-0.004
-0.85%
1 jan 2012 ano
0.449
+0.012
2.8%
1 jan 2013 ano
0.432
-0.016
-3.6%
1 jan 2014 ano
0.429
-0.004
-0.84%
1 jan 2015 ano
0.431
+0.002
0.5%
Classificação de países por estatísticas atuais por anos


Comentários: