29
/pt/
pt
AIzaSyAYiBZKx7MnpbEhh9jyipgxe19OcubqV5w
April 1, 2024
135931
Gabon
GAB
true
2
1
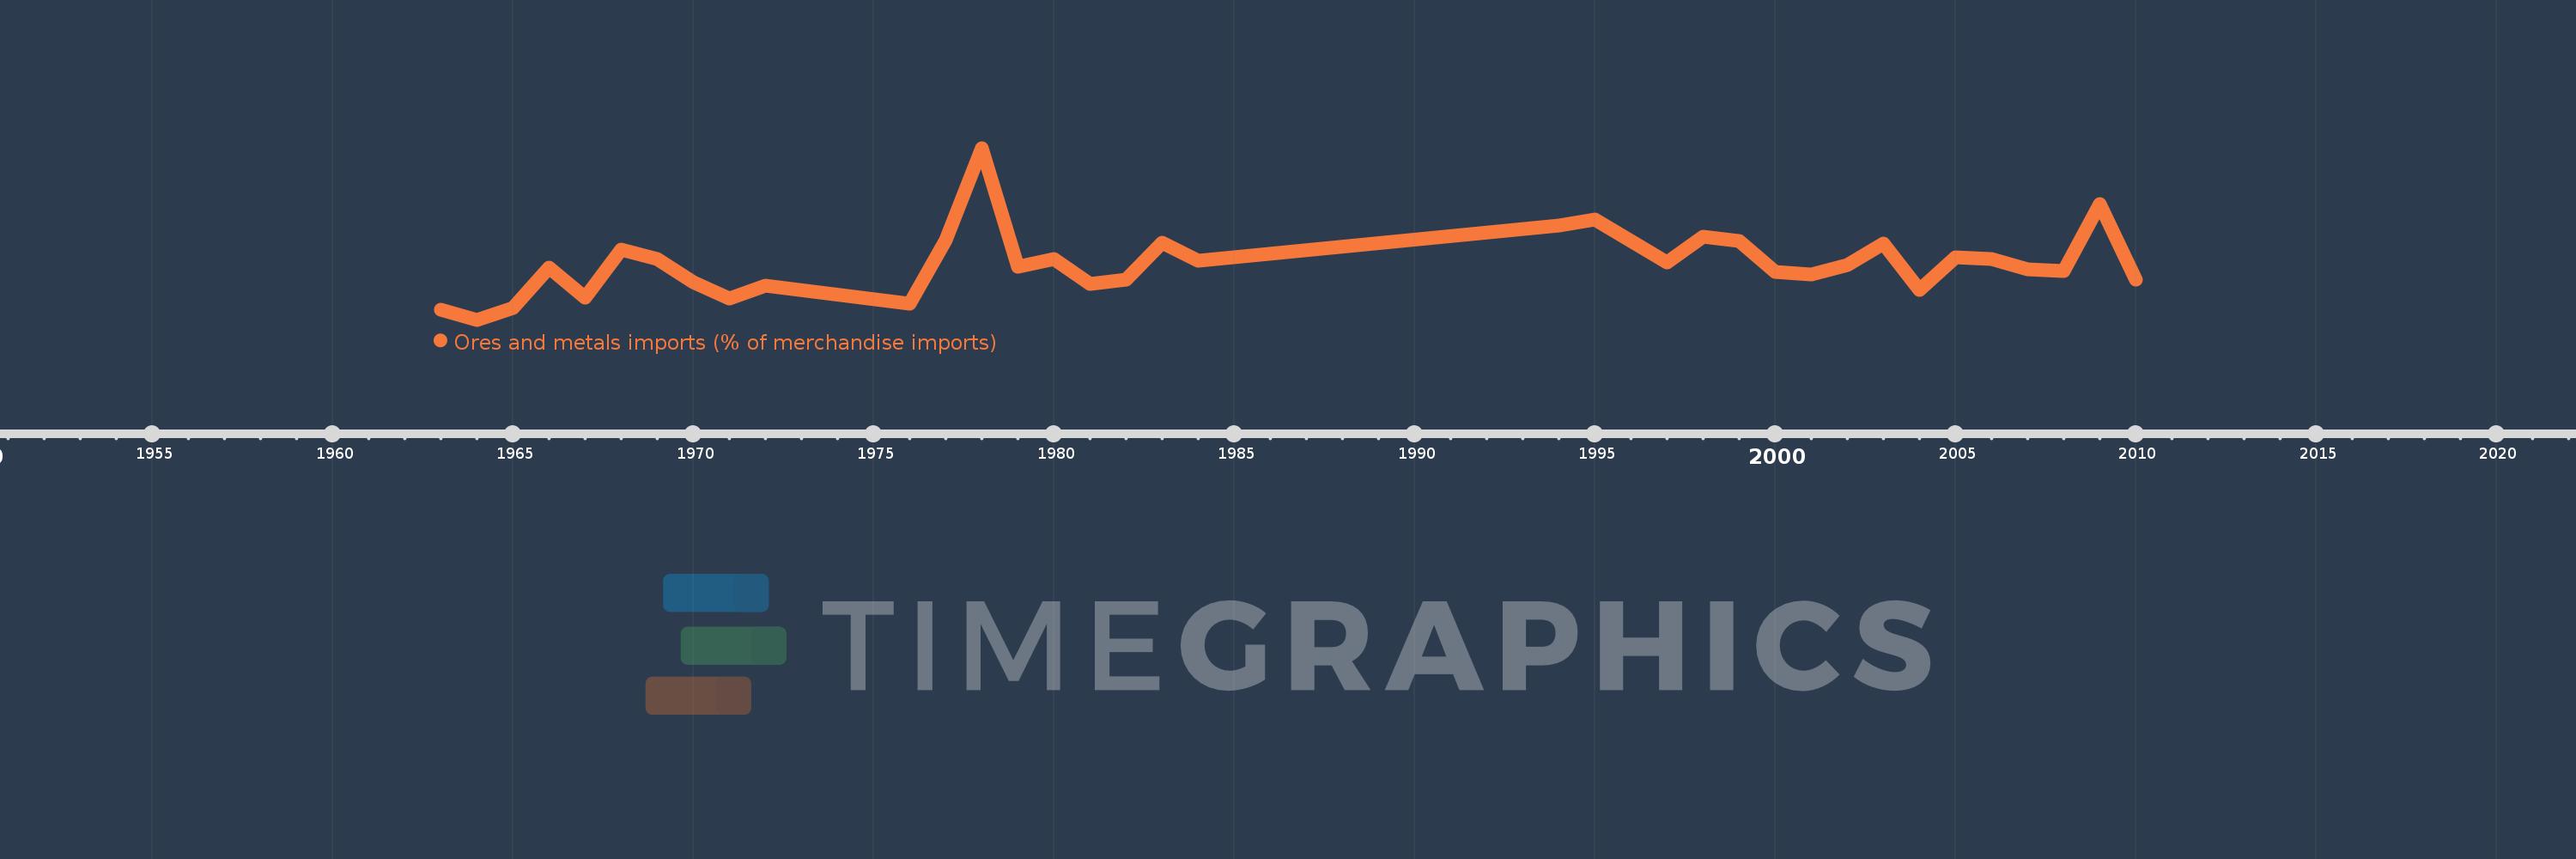
Ores and metals imports (% of merchandise imports)
2010,2009,2008,2007,2006,2005,2004,2003,2002,2001,2000,1999,1998,1997,1995,1994,1984,1983,1982,1981,1980,1979,1978,1977,1976,1972,1971,1970,1969,1968,1967,1966,1965,1964,1963
Estas estatísticas em outros países:
AfghanistanAlbaniaAlgeriaAndorraAngolaAntigua and BarbudaArab WorldArgentinaArmeniaArubaAustraliaAustriaAzerbaijanBahamas, TheBahrainBangladeshBarbadosBelarusBelgiumBelizeBeninBermudaBhutanBoliviaBosnia and HerzegovinaBotswanaBrazilBrunei DarussalamBulgariaBurkina FasoBurundiCabo VerdeCambodiaCameroonCanadaCaribbean small statesCayman IslandsCentral African RepublicCentral Europe and the BalticsChadChileChinaColombiaComorosCongo, Dem. Rep.Congo, Rep.Costa RicaCote d'IvoireCroatiaCubaCyprusCzech RepublicDenmarkDjiboutiDominicaDominican RepublicEarly-demographic dividendEast Asia & PacificEast Asia & Pacific (excluding high income)East Asia & Pacific (IDA & IBRD countries)EcuadorEgypt, Arab Rep.El SalvadorEquatorial GuineaEritreaEstoniaEthiopiaEuro areaEurope & Central AsiaEurope & Central Asia (excluding high income)Europe & Central Asia (IDA & IBRD countries)European UnionFaroe IslandsFijiFinlandFragile and conflict affected situationsFranceFrench PolynesiaGabonGambia, TheGeorgiaGermanyGhanaGreeceGreenlandGrenadaGuatemalaGuineaGuinea-BissauGuyanaHaitiHeavily indebted poor countries (HIPC)High incomeHondurasHong Kong SAR, ChinaHungaryIBRD onlyIcelandIDA & IBRD totalIDA blendIDA onlyIDA totalIndiaIndonesiaIran, Islamic Rep.IraqIrelandIsraelItalyJamaicaJapanJordanKazakhstanKenyaKiribatiKorea, Rep.KuwaitKyrgyz RepublicLao PDRLate-demographic dividendLatin America & Caribbean Latin America & Caribbean (excluding high income)Latin America & the Caribbean (IDA & IBRD countries)LatviaLeast developed countries: UN classificationLebanonLesothoLiberiaLibyaLithuaniaLow & middle incomeLow incomeLower middle incomeLuxembourgMacao SAR, ChinaMacedonia, FYRMadagascarMalawiMalaysiaMaldivesMaliMaltaMauritaniaMauritiusMexicoMiddle East & North AfricaMiddle East & North Africa (excluding high income)Middle East & North Africa (IDA & IBRD countries)Middle incomeMoldovaMongoliaMoroccoMozambiqueMyanmarNamibiaNepalNetherlandsNew CaledoniaNew ZealandNicaraguaNigerNigeriaNorth AmericaNorwayOECD membersOmanOther small statesPacific island small statesPakistanPalauPanamaPapua New GuineaParaguayPeruPhilippinesPolandPortugalPost-demographic dividendPre-demographic dividendQatarRomaniaRussian FederationRwandaSamoaSao Tome and PrincipeSaudi ArabiaSenegalSerbiaSeychellesSierra LeoneSingaporeSlovak RepublicSloveniaSmall statesSolomon IslandsSomaliaSouth AfricaSouth AsiaSouth Asia (IDA & IBRD)SpainSri LankaSt. Kitts and NevisSt. LuciaSt. Vincent and the GrenadinesSub-Saharan Africa Sub-Saharan Africa (excluding high income)Sub-Saharan Africa (IDA & IBRD countries)SudanSurinameSwazilandSwedenSwitzerlandSyrian Arab RepublicTajikistanTanzaniaThailandTimor-LesteTogoTongaTrinidad and TobagoTunisiaTurkeyTurkmenistanTurks and Caicos IslandsTuvaluUgandaUkraineUnited Arab EmiratesUnited KingdomUnited StatesUpper middle incomeUruguayVanuatuVenezuela, RBVietnamVirgin Islands (U.S.)WorldYemen, Rep.ZambiaZimbabwe Linha do tempo:
Nesta escala de tempo está apresentado um gráfico de 1963 ano até 2010 ano Gabon. Dados de 1962 ano ausente. O número de observações reais por data: 35.
Fonte (nome):
Indicadores de desenvolvimento mundial
Fonte (organização):
World Bank staff estimates from the Comtrade database maintained by the United Nations Statistics Division.
Categorias:
Energy & Mining, Private Sector, Trade
Foi atualizado:
23 abr 2017 ano
Indicadores de alterações dos valores ao longo dos anos
Mínimo:
0.697
1 jan 1964 ano
Máximo:
2.002
1 jan 1978 ano
Na data de observação
Valor
Mudança absoluta
A alteração em relação ao valor anterior
1 jan 1963 ano
0.773
+0.773
0.0%
1 jan 1964 ano
0.697
-0.075
-9.75%
1 jan 1965 ano
0.784
+0.087
12.47%
1 jan 1966 ano
1.093
+0.309
39.4%
1 jan 1967 ano
0.867
-0.226
-20.68%
1 jan 1968 ano
1.228
+0.361
41.6%
1 jan 1969 ano
1.161
-0.066
-5.4%
1 jan 1970 ano
0.984
-0.177
-15.27%
1 jan 1971 ano
0.86
-0.124
-12.56%
1 jan 1972 ano
0.959
+0.099
11.46%
1 jan 1976 ano
0.817
-0.142
-14.79%
1 jan 1977 ano
1.302
+0.485
59.31%
1 jan 1978 ano
2.002
+0.7
53.78%
1 jan 1979 ano
1.1
-0.902
-45.05%
1 jan 1980 ano
1.16
+0.06
5.43%
1 jan 1981 ano
0.971
-0.189
-16.3%
1 jan 1982 ano
1.004
+0.034
3.46%
1 jan 1983 ano
1.281
+0.276
27.51%
1 jan 1984 ano
1.147
-0.134
-10.46%
1 jan 1994 ano
1.416
+0.269
23.47%
1 jan 1995 ano
1.46
+0.044
3.11%
1 jan 1997 ano
1.132
-0.328
-22.46%
1 jan 1998 ano
1.329
+0.197
17.39%
1 jan 1999 ano
1.297
-0.031
-2.37%
1 jan 2000 ano
1.063
-0.235
-18.07%
1 jan 2001 ano
1.038
-0.025
-2.39%
1 jan 2002 ano
1.112
+0.075
7.19%
1 jan 2003 ano
1.278
+0.166
14.9%
1 jan 2004 ano
0.925
-0.353
-27.6%
1 jan 2005 ano
1.17
+0.245
26.46%
1 jan 2006 ano
1.158
-0.012
-1.06%
1 jan 2007 ano
1.079
-0.079
-6.8%
1 jan 2008 ano
1.064
-0.015
-1.39%
1 jan 2009 ano
1.579
+0.515
48.44%
1 jan 2010 ano
1.004
-0.575
-36.43%
Classificação de países por estatísticas atuais por anos


Comentários: