29
/pt/
pt
AIzaSyAYiBZKx7MnpbEhh9jyipgxe19OcubqV5w
April 1, 2024
132398
Fiji
FJI
true
2
1
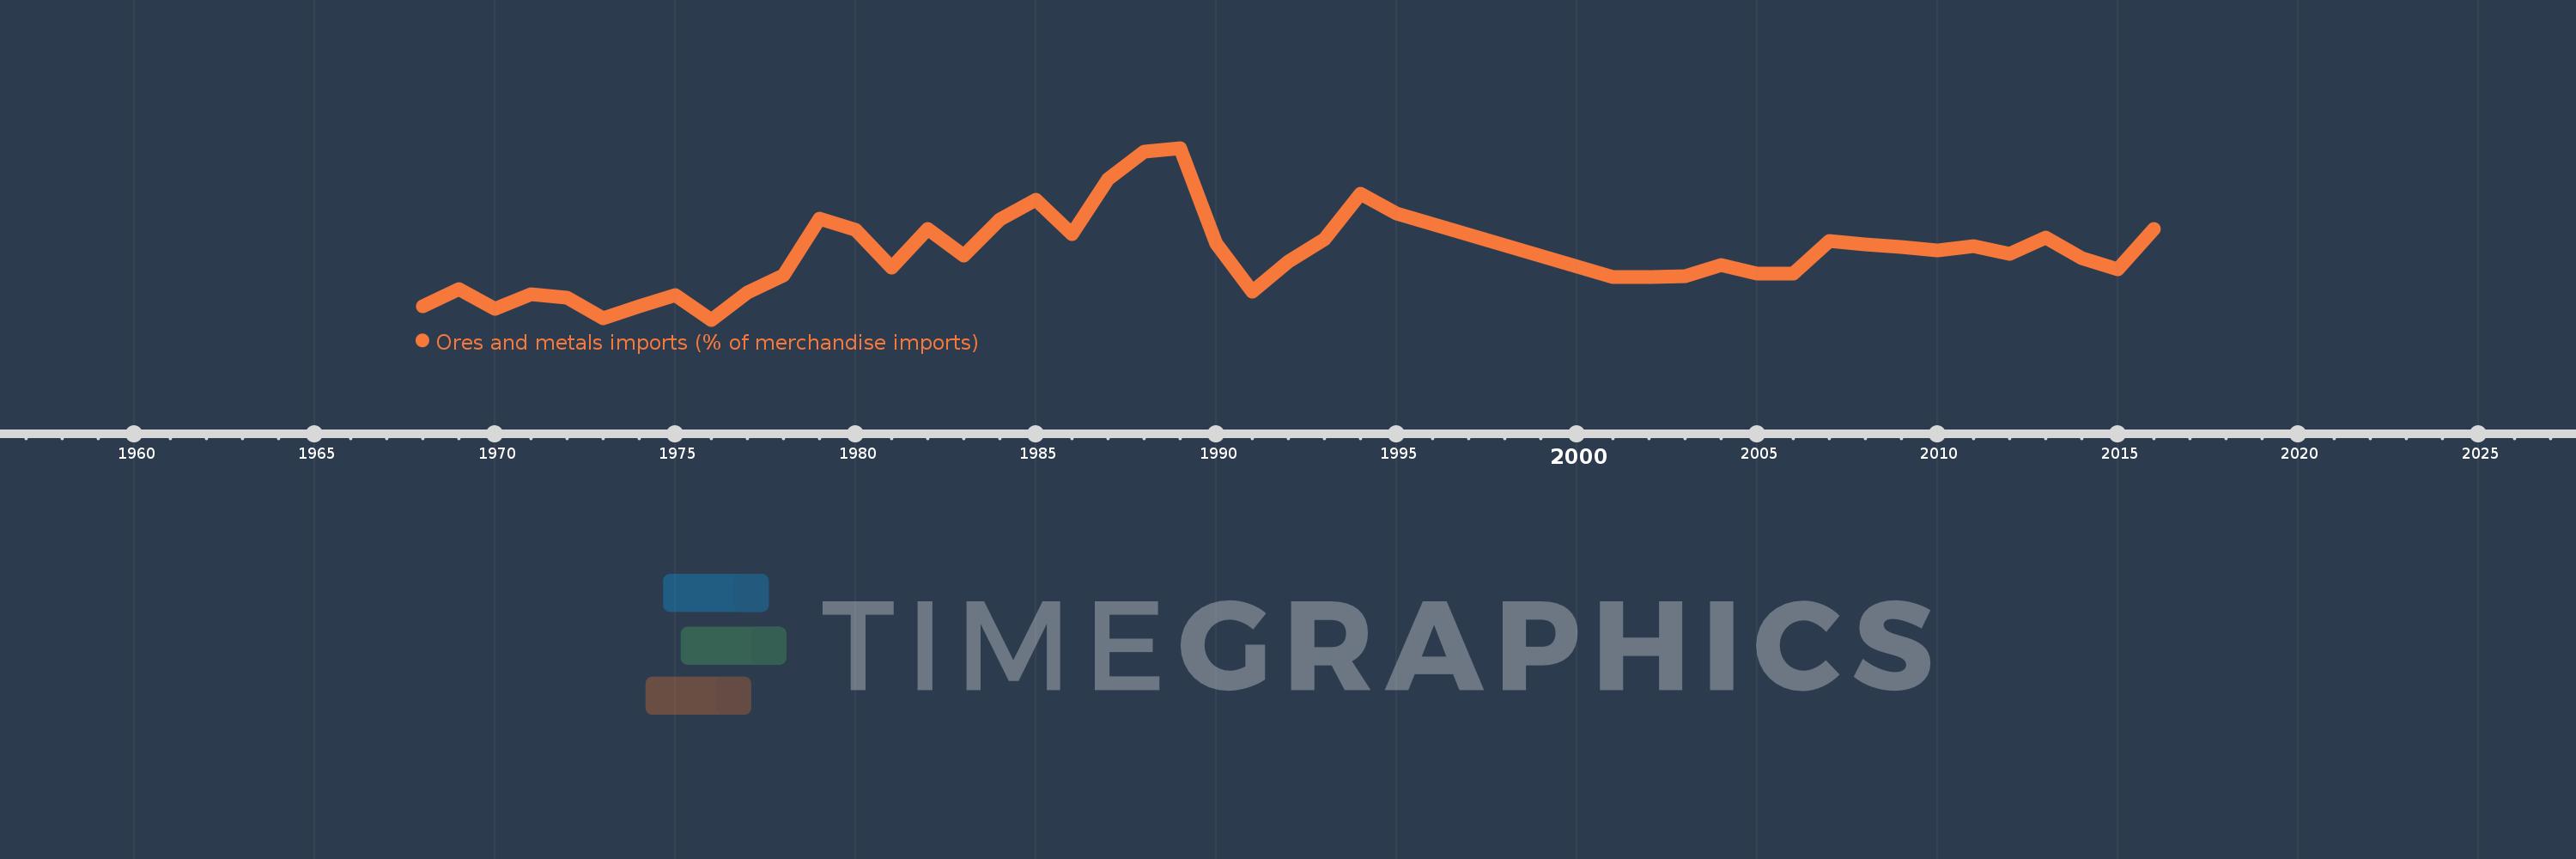
Ores and metals imports (% of merchandise imports)
2016,2015,2014,2013,2012,2011,2010,2009,2008,2007,2006,2005,2004,2003,2002,2001,1995,1994,1993,1992,1991,1990,1989,1988,1987,1986,1985,1984,1983,1982,1981,1980,1979,1978,1977,1976,1975,1974,1973,1972,1971,1970,1969,1968
Estas estatísticas em outros países:
AfghanistanAlbaniaAlgeriaAndorraAngolaAntigua and BarbudaArab WorldArgentinaArmeniaArubaAustraliaAustriaAzerbaijanBahamas, TheBahrainBangladeshBarbadosBelarusBelgiumBelizeBeninBermudaBhutanBoliviaBosnia and HerzegovinaBotswanaBrazilBrunei DarussalamBulgariaBurkina FasoBurundiCabo VerdeCambodiaCameroonCanadaCaribbean small statesCayman IslandsCentral African RepublicCentral Europe and the BalticsChadChileChinaColombiaComorosCongo, Dem. Rep.Congo, Rep.Costa RicaCote d'IvoireCroatiaCubaCyprusCzech RepublicDenmarkDjiboutiDominicaDominican RepublicEarly-demographic dividendEast Asia & PacificEast Asia & Pacific (excluding high income)East Asia & Pacific (IDA & IBRD countries)EcuadorEgypt, Arab Rep.El SalvadorEquatorial GuineaEritreaEstoniaEthiopiaEuro areaEurope & Central AsiaEurope & Central Asia (excluding high income)Europe & Central Asia (IDA & IBRD countries)European UnionFaroe IslandsFijiFinlandFragile and conflict affected situationsFranceFrench PolynesiaGabonGambia, TheGeorgiaGermanyGhanaGreeceGreenlandGrenadaGuatemalaGuineaGuinea-BissauGuyanaHaitiHeavily indebted poor countries (HIPC)High incomeHondurasHong Kong SAR, ChinaHungaryIBRD onlyIcelandIDA & IBRD totalIDA blendIDA onlyIDA totalIndiaIndonesiaIran, Islamic Rep.IraqIrelandIsraelItalyJamaicaJapanJordanKazakhstanKenyaKiribatiKorea, Rep.KuwaitKyrgyz RepublicLao PDRLate-demographic dividendLatin America & Caribbean Latin America & Caribbean (excluding high income)Latin America & the Caribbean (IDA & IBRD countries)LatviaLeast developed countries: UN classificationLebanonLesothoLiberiaLibyaLithuaniaLow & middle incomeLow incomeLower middle incomeLuxembourgMacao SAR, ChinaMacedonia, FYRMadagascarMalawiMalaysiaMaldivesMaliMaltaMauritaniaMauritiusMexicoMiddle East & North AfricaMiddle East & North Africa (excluding high income)Middle East & North Africa (IDA & IBRD countries)Middle incomeMoldovaMongoliaMoroccoMozambiqueMyanmarNamibiaNepalNetherlandsNew CaledoniaNew ZealandNicaraguaNigerNigeriaNorth AmericaNorwayOECD membersOmanOther small statesPacific island small statesPakistanPalauPanamaPapua New GuineaParaguayPeruPhilippinesPolandPortugalPost-demographic dividendPre-demographic dividendQatarRomaniaRussian FederationRwandaSamoaSao Tome and PrincipeSaudi ArabiaSenegalSerbiaSeychellesSierra LeoneSingaporeSlovak RepublicSloveniaSmall statesSolomon IslandsSomaliaSouth AfricaSouth AsiaSouth Asia (IDA & IBRD)SpainSri LankaSt. Kitts and NevisSt. LuciaSt. Vincent and the GrenadinesSub-Saharan Africa Sub-Saharan Africa (excluding high income)Sub-Saharan Africa (IDA & IBRD countries)SudanSurinameSwazilandSwedenSwitzerlandSyrian Arab RepublicTajikistanTanzaniaThailandTimor-LesteTogoTongaTrinidad and TobagoTunisiaTurkeyTurkmenistanTurks and Caicos IslandsTuvaluUgandaUkraineUnited Arab EmiratesUnited KingdomUnited StatesUpper middle incomeUruguayVanuatuVenezuela, RBVietnamVirgin Islands (U.S.)WorldYemen, Rep.ZambiaZimbabwe Linha do tempo:
Nesta escala de tempo está apresentado um gráfico de 1968 ano até 2016 ano Fiji. Dados de 1967 ano ausente. O número de observações reais por data: 44.
Fonte (nome):
Indicadores de desenvolvimento mundial
Fonte (organização):
World Bank staff estimates from the Comtrade database maintained by the United Nations Statistics Division.
Categorias:
Energy & Mining, Private Sector, Trade
Foi atualizado:
23 abr 2017 ano
Indicadores de alterações dos valores ao longo dos anos
Mínimo:
0.567
1 jan 1976 ano
Máximo:
1.713
1 jan 1989 ano
Na data de observação
Valor
Mudança absoluta
A alteração em relação ao valor anterior
1 jan 1968 ano
0.659
+0.659
0.0%
1 jan 1969 ano
0.774
+0.115
17.51%
1 jan 1970 ano
0.642
-0.132
-17.0%
1 jan 1971 ano
0.739
+0.097
15.08%
1 jan 1972 ano
0.716
-0.023
-3.11%
1 jan 1973 ano
0.575
-0.141
-19.67%
1 jan 1974 ano
0.655
+0.08
13.85%
1 jan 1975 ano
0.732
+0.077
11.7%
1 jan 1976 ano
0.567
-0.165
-22.58%
1 jan 1977 ano
0.747
+0.181
31.91%
1 jan 1978 ano
0.863
+0.115
15.44%
1 jan 1979 ano
1.242
+0.38
44.02%
1 jan 1980 ano
1.167
-0.075
-6.06%
1 jan 1981 ano
0.912
-0.255
-21.88%
1 jan 1982 ano
1.173
+0.261
28.67%
1 jan 1983 ano
0.997
-0.176
-15.04%
1 jan 1984 ano
1.233
+0.236
23.7%
1 jan 1985 ano
1.366
+0.133
10.8%
1 jan 1986 ano
1.139
-0.227
-16.6%
1 jan 1987 ano
1.505
+0.365
32.06%
1 jan 1988 ano
1.687
+0.182
12.13%
1 jan 1989 ano
1.713
+0.026
1.53%
1 jan 1990 ano
1.074
-0.639
-37.31%
1 jan 1991 ano
0.753
-0.321
-29.88%
1 jan 1992 ano
0.954
+0.201
26.67%
1 jan 1993 ano
1.104
+0.151
15.78%
1 jan 1994 ano
1.408
+0.303
27.47%
1 jan 1995 ano
1.276
-0.132
-9.36%
1 jan 2001 ano
0.849
-0.427
-33.49%
1 jan 2002 ano
0.852
+0.003
0.36%
1 jan 2003 ano
0.858
+0.006
0.73%
1 jan 2004 ano
0.93
+0.072
8.39%
1 jan 2005 ano
0.877
-0.052
-5.63%
1 jan 2006 ano
0.877
0.0
-0.05%
1 jan 2007 ano
1.093
+0.216
24.6%
1 jan 2008 ano
1.068
-0.025
-2.29%
1 jan 2009 ano
1.053
-0.015
-1.36%
1 jan 2010 ano
1.028
-0.025
-2.42%
1 jan 2011 ano
1.057
+0.029
2.82%
1 jan 2012 ano
1.009
-0.047
-4.48%
1 jan 2013 ano
1.113
+0.104
10.29%
1 jan 2014 ano
0.979
-0.134
-12.05%
1 jan 2015 ano
0.906
-0.073
-7.43%
1 jan 2016 ano
1.172
+0.266
29.33%
Classificação de países por estatísticas atuais por anos


Comentários: