29
/pt/
pt
AIzaSyAYiBZKx7MnpbEhh9jyipgxe19OcubqV5w
April 1, 2024
134408
France
FRA
true
2
1
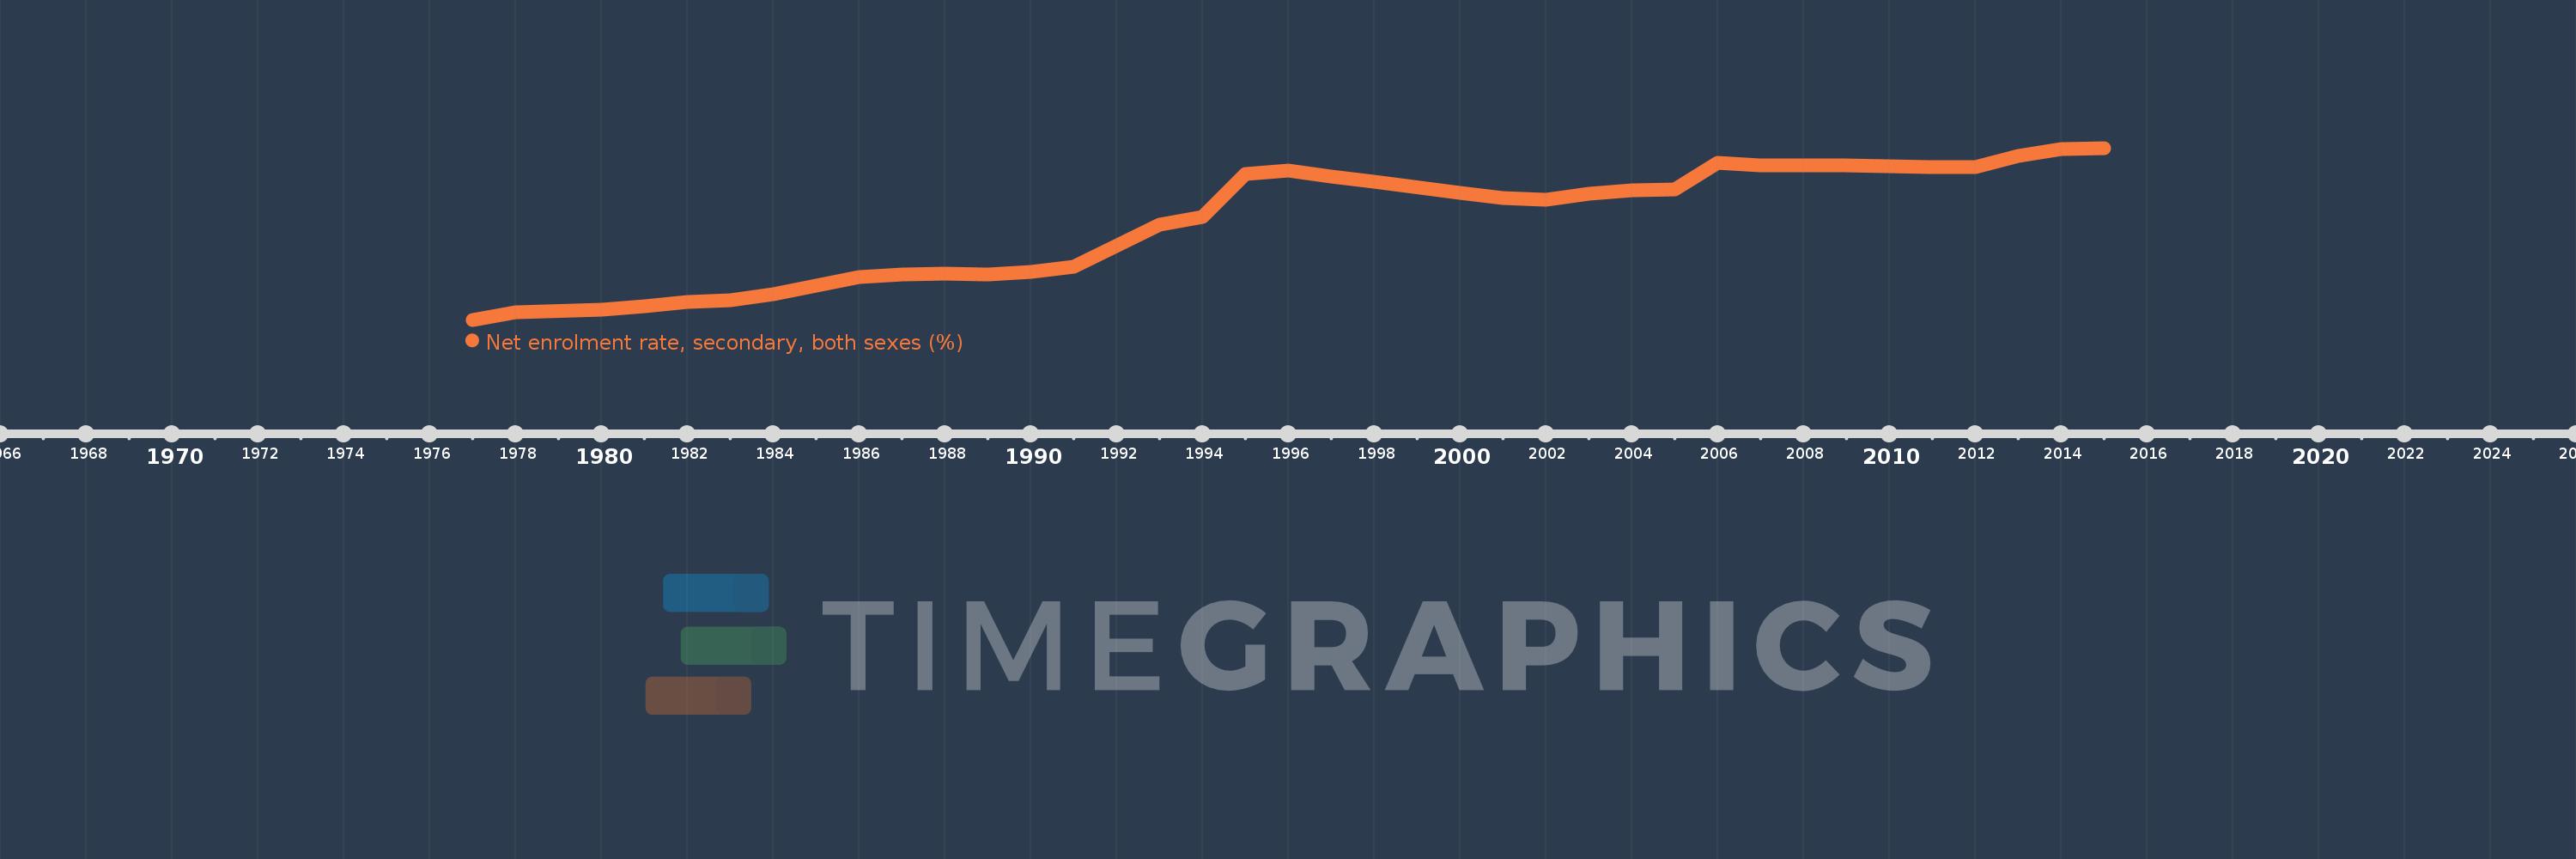
Net enrolment rate, secondary, both sexes (%)
2015,2014,2013,2012,2011,2010,2009,2008,2007,2006,2005,2004,2003,2002,2001,2000,1998,1997,1996,1995,1994,1993,1991,1990,1989,1988,1987,1986,1984,1983,1982,1981,1980,1978,1977
Estas estatísticas em outros países:
AfghanistanAlbaniaAlgeriaAngolaAntigua and BarbudaArab WorldArgentinaArmeniaArubaAustraliaAustriaAzerbaijanBahamas, TheBahrainBangladeshBarbadosBelarusBelgiumBelizeBeninBermudaBhutanBoliviaBotswanaBrazilBritish Virgin IslandsBrunei DarussalamBulgariaBurkina FasoBurundiCabo VerdeCambodiaCameroonCanadaCaribbean small statesCentral African RepublicCentral Europe and the BalticsChadChileColombiaComorosCongo, Dem. Rep.Congo, Rep.Costa RicaCroatiaCubaCyprusDenmarkDjiboutiDominicaDominican RepublicEarly-demographic dividendEast Asia & PacificEast Asia & Pacific (excluding high income)East Asia & Pacific (IDA & IBRD countries)EcuadorEgypt, Arab Rep.El SalvadorEquatorial GuineaEritreaEstoniaEthiopiaEuro areaEurope & Central AsiaEurope & Central Asia (excluding high income)Europe & Central Asia (IDA & IBRD countries)European UnionFijiFinlandFragile and conflict affected situationsFranceGambia, TheGeorgiaGhanaGreeceGrenadaGuatemalaGuineaGuinea-BissauGuyanaHeavily indebted poor countries (HIPC)High incomeHondurasHong Kong SAR, ChinaHungaryIBRD onlyIcelandIDA & IBRD totalIDA blendIDA onlyIDA totalIndiaIndonesiaIran, Islamic Rep.IraqIrelandIsraelItalyJamaicaJapanJordanKazakhstanKenyaKiribatiKorea, Dem. People’s Rep.Korea, Rep.KuwaitKyrgyz RepublicLao PDRLate-demographic dividendLatin America & Caribbean Latin America & Caribbean (excluding high income)Latin America & the Caribbean (IDA & IBRD countries)LatviaLeast developed countries: UN classificationLebanonLesothoLibyaLiechtensteinLithuaniaLow & middle incomeLow incomeLower middle incomeLuxembourgMacao SAR, ChinaMacedonia, FYRMadagascarMalawiMalaysiaMaldivesMaliMaltaMarshall IslandsMauritaniaMauritiusMexicoMiddle East & North AfricaMiddle East & North Africa (excluding high income)Middle East & North Africa (IDA & IBRD countries)Middle incomeMoldovaMongoliaMoroccoMozambiqueMyanmarNamibiaNauruNepalNetherlandsNew ZealandNicaraguaNigerNorth AmericaNorwayOECD membersOmanOther small statesPacific island small statesPakistanPanamaParaguayPeruPhilippinesPolandPortugalPost-demographic dividendPre-demographic dividendPuerto RicoQatarRomaniaSamoaSao Tome and PrincipeSaudi ArabiaSenegalSerbiaSeychellesSierra LeoneSloveniaSmall statesSolomon IslandsSomaliaSouth AfricaSouth AsiaSouth Asia (IDA & IBRD)SpainSri LankaSt. Kitts and NevisSt. LuciaSt. Vincent and the GrenadinesSub-Saharan Africa Sub-Saharan Africa (excluding high income)Sub-Saharan Africa (IDA & IBRD countries)SurinameSwazilandSwedenSwitzerlandSyrian Arab RepublicTajikistanThailandTimor-LesteTogoTongaTrinidad and TobagoTunisiaTurkeyTuvaluUgandaUkraineUnited Arab EmiratesUnited KingdomUnited StatesUpper middle incomeUruguayVanuatuVenezuela, RBVietnamWest Bank and GazaWorldYemen, Rep.Zimbabwe Linha do tempo:
Nesta escala de tempo está apresentado um gráfico de 1977 ano até 2015 ano France. Dados de 1976 ano ausente. O número de observações reais por data: 35.
Fonte (nome):
Indicadores de desenvolvimento mundial
Fonte (organização):
UNESCO Institute for Statistics
Categorias:
Education
Foi atualizado:
23 abr 2017 ano
Indicadores de alterações dos valores ao longo dos anos
Mínimo:
76.177
1 jan 1977 ano
Máximo:
99.444
1 jan 2015 ano
Na data de observação
Valor
Mudança absoluta
A alteração em relação ao valor anterior
1 jan 1977 ano
76.177
+76.177
0.0%
1 jan 1978 ano
77.164
+0.987
1.3%
1 jan 1980 ano
77.524
+0.36
0.47%
1 jan 1981 ano
78.06
+0.536
0.69%
1 jan 1982 ano
78.551
+0.491
0.63%
1 jan 1983 ano
78.791
+0.24
0.31%
1 jan 1984 ano
79.686
+0.895
1.14%
1 jan 1986 ano
81.992
+2.305
2.89%
1 jan 1987 ano
82.283
+0.292
0.36%
1 jan 1988 ano
82.379
+0.096
0.12%
1 jan 1989 ano
82.364
-0.015
-0.02%
1 jan 1990 ano
82.678
+0.314
0.38%
1 jan 1991 ano
83.36
+0.682
0.82%
1 jan 1993 ano
89.084
+5.724
6.87%
1 jan 1994 ano
90.089
+1.005
1.13%
1 jan 1995 ano
95.866
+5.777
6.41%
1 jan 1996 ano
96.436
+0.57
0.59%
1 jan 1997 ano
95.609
-0.827
-0.86%
1 jan 1998 ano
94.922
-0.686
-0.72%
1 jan 2000 ano
93.338
-1.584
-1.67%
1 jan 2001 ano
92.629
-0.709
-0.76%
1 jan 2002 ano
92.468
-0.161
-0.17%
1 jan 2003 ano
93.198
+0.73
0.79%
1 jan 2004 ano
93.716
+0.518
0.56%
1 jan 2005 ano
93.85
+0.134
0.14%
1 jan 2006 ano
97.397
+3.547
3.78%
1 jan 2007 ano
97.124
-0.274
-0.28%
1 jan 2008 ano
97.073
-0.051
-0.05%
1 jan 2009 ano
97.115
+0.043
0.04%
1 jan 2010 ano
96.992
-0.123
-0.13%
1 jan 2011 ano
96.822
-0.17
-0.18%
1 jan 2012 ano
96.883
+0.061
0.06%
1 jan 2013 ano
98.382
+1.499
1.55%
1 jan 2014 ano
99.267
+0.884
0.9%
1 jan 2015 ano
99.444
+0.178
0.18%
Classificação de países por estatísticas atuais por anos


Comentários: