29
/pt/
pt
AIzaSyAYiBZKx7MnpbEhh9jyipgxe19OcubqV5w
April 1, 2024
117214
Cyprus
CYP
true
2
1
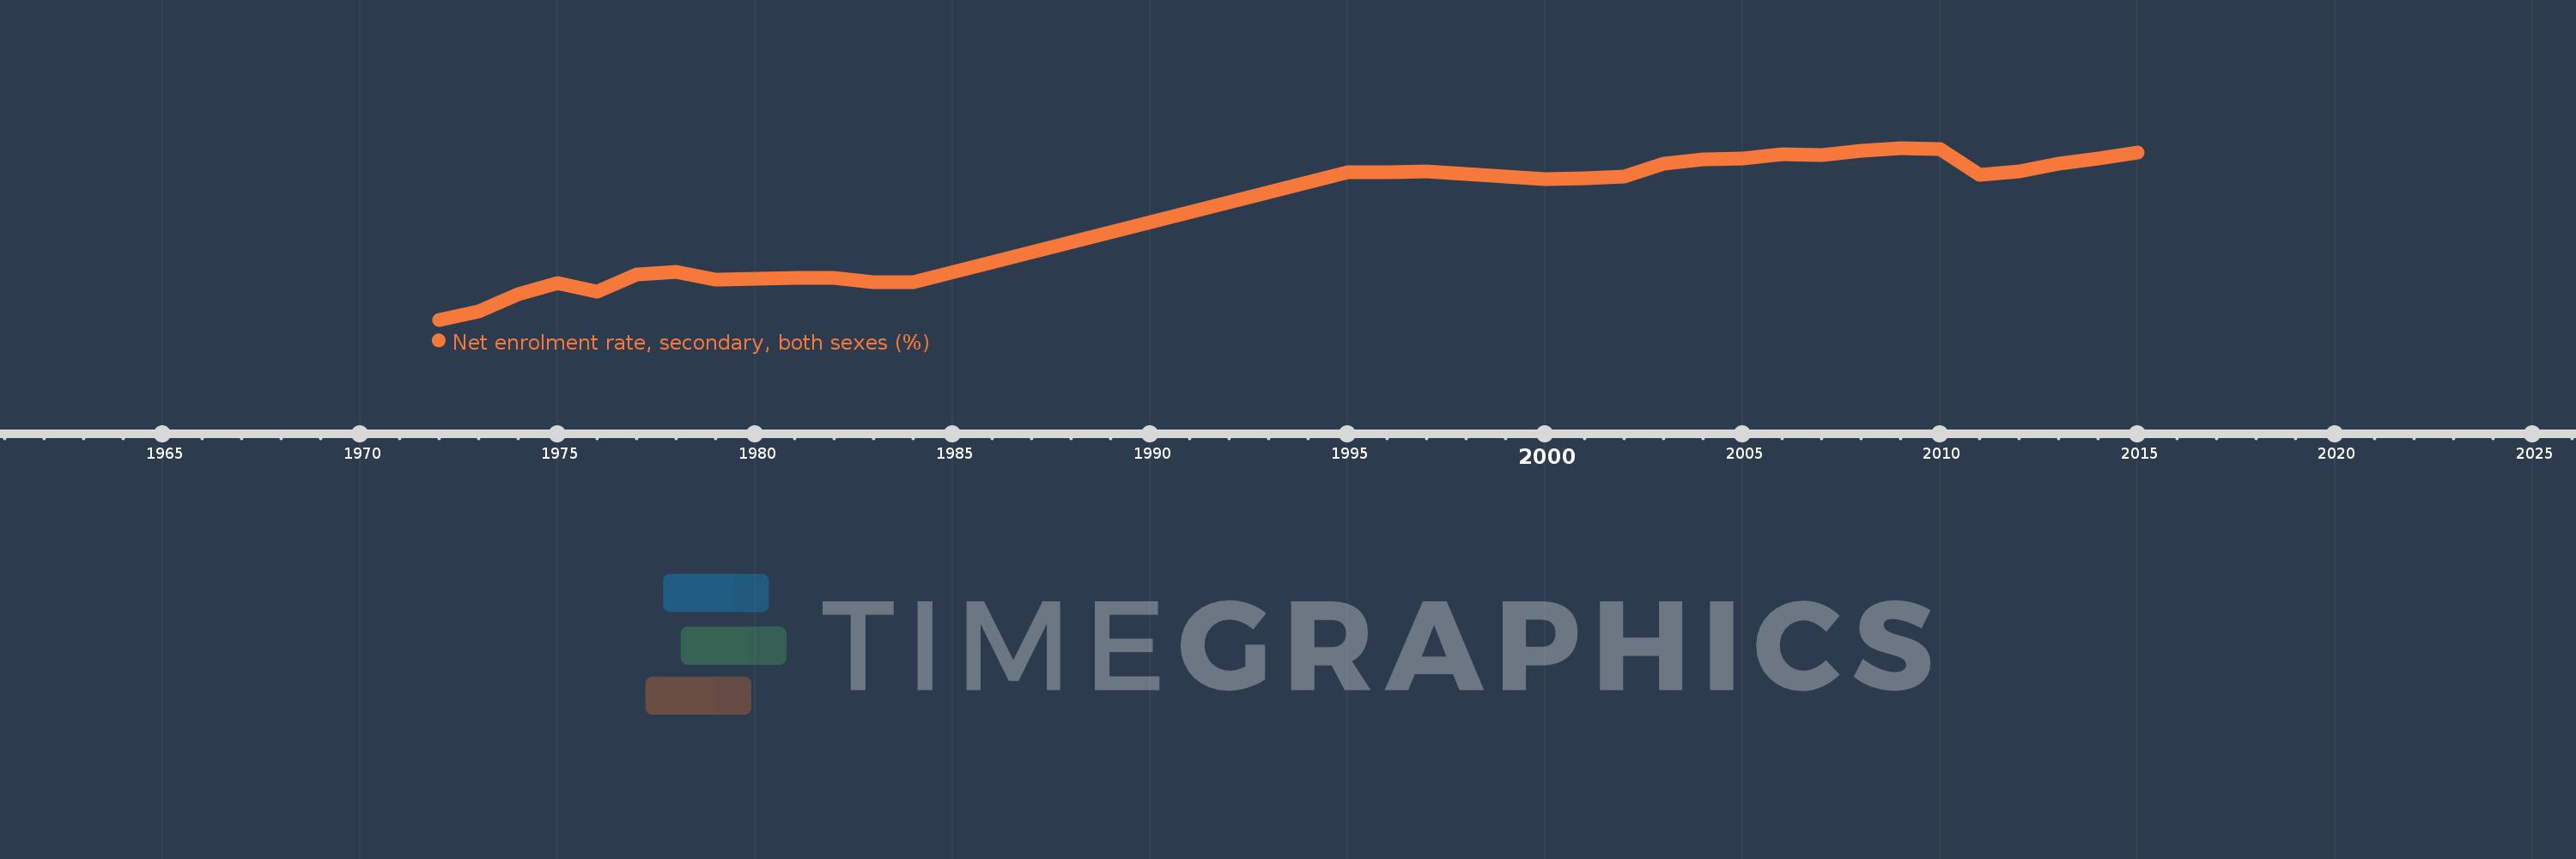
Net enrolment rate, secondary, both sexes (%)
2015,2014,2013,2012,2011,2010,2009,2008,2007,2006,2005,2004,2003,2002,2001,2000,1998,1997,1996,1995,1984,1983,1982,1981,1980,1979,1978,1977,1976,1975,1974,1973,1972
Estas estatísticas em outros países:
AfghanistanAlbaniaAlgeriaAngolaAntigua and BarbudaArab WorldArgentinaArmeniaArubaAustraliaAustriaAzerbaijanBahamas, TheBahrainBangladeshBarbadosBelarusBelgiumBelizeBeninBermudaBhutanBoliviaBotswanaBrazilBritish Virgin IslandsBrunei DarussalamBulgariaBurkina FasoBurundiCabo VerdeCambodiaCameroonCanadaCaribbean small statesCentral African RepublicCentral Europe and the BalticsChadChileColombiaComorosCongo, Dem. Rep.Congo, Rep.Costa RicaCroatiaCubaCyprusDenmarkDjiboutiDominicaDominican RepublicEarly-demographic dividendEast Asia & PacificEast Asia & Pacific (excluding high income)East Asia & Pacific (IDA & IBRD countries)EcuadorEgypt, Arab Rep.El SalvadorEquatorial GuineaEritreaEstoniaEthiopiaEuro areaEurope & Central AsiaEurope & Central Asia (excluding high income)Europe & Central Asia (IDA & IBRD countries)European UnionFijiFinlandFragile and conflict affected situationsFranceGambia, TheGeorgiaGhanaGreeceGrenadaGuatemalaGuineaGuinea-BissauGuyanaHeavily indebted poor countries (HIPC)High incomeHondurasHong Kong SAR, ChinaHungaryIBRD onlyIcelandIDA & IBRD totalIDA blendIDA onlyIDA totalIndiaIndonesiaIran, Islamic Rep.IraqIrelandIsraelItalyJamaicaJapanJordanKazakhstanKenyaKiribatiKorea, Dem. People’s Rep.Korea, Rep.KuwaitKyrgyz RepublicLao PDRLate-demographic dividendLatin America & Caribbean Latin America & Caribbean (excluding high income)Latin America & the Caribbean (IDA & IBRD countries)LatviaLeast developed countries: UN classificationLebanonLesothoLibyaLiechtensteinLithuaniaLow & middle incomeLow incomeLower middle incomeLuxembourgMacao SAR, ChinaMacedonia, FYRMadagascarMalawiMalaysiaMaldivesMaliMaltaMarshall IslandsMauritaniaMauritiusMexicoMiddle East & North AfricaMiddle East & North Africa (excluding high income)Middle East & North Africa (IDA & IBRD countries)Middle incomeMoldovaMongoliaMoroccoMozambiqueMyanmarNamibiaNauruNepalNetherlandsNew ZealandNicaraguaNigerNorth AmericaNorwayOECD membersOmanOther small statesPacific island small statesPakistanPanamaParaguayPeruPhilippinesPolandPortugalPost-demographic dividendPre-demographic dividendPuerto RicoQatarRomaniaSamoaSao Tome and PrincipeSaudi ArabiaSenegalSerbiaSeychellesSierra LeoneSloveniaSmall statesSolomon IslandsSomaliaSouth AfricaSouth AsiaSouth Asia (IDA & IBRD)SpainSri LankaSt. Kitts and NevisSt. LuciaSt. Vincent and the GrenadinesSub-Saharan Africa Sub-Saharan Africa (excluding high income)Sub-Saharan Africa (IDA & IBRD countries)SurinameSwazilandSwedenSwitzerlandSyrian Arab RepublicTajikistanThailandTimor-LesteTogoTongaTrinidad and TobagoTunisiaTurkeyTuvaluUgandaUkraineUnited Arab EmiratesUnited KingdomUnited StatesUpper middle incomeUruguayVanuatuVenezuela, RBVietnamWest Bank and GazaWorldYemen, Rep.Zimbabwe Linha do tempo:
Nesta escala de tempo está apresentado um gráfico de 1972 ano até 2015 ano Cyprus. Dados de 1971 ano ausente. O número de observações reais por data: 33.
Fonte (nome):
Indicadores de desenvolvimento mundial
Fonte (organização):
UNESCO Institute for Statistics
Categorias:
Education
Foi atualizado:
23 abr 2017 ano
Indicadores de alterações dos valores ao longo dos anos
Mínimo:
51.227
1 jan 1972 ano
Máximo:
95.804
1 jan 2009 ano
Na data de observação
Valor
Mudança absoluta
A alteração em relação ao valor anterior
1 jan 1972 ano
51.227
+51.227
0.0%
1 jan 1973 ano
53.416
+2.189
4.27%
1 jan 1974 ano
57.922
+4.506
8.44%
1 jan 1975 ano
60.634
+2.712
4.68%
1 jan 1976 ano
58.59
-2.044
-3.37%
1 jan 1977 ano
63.06
+4.471
7.63%
1 jan 1978 ano
63.542
+0.481
0.76%
1 jan 1979 ano
61.746
-1.795
-2.83%
1 jan 1980 ano
61.924
+0.177
0.29%
1 jan 1981 ano
62.144
+0.221
0.36%
1 jan 1982 ano
62.03
-0.114
-0.18%
1 jan 1983 ano
60.88
-1.15
-1.85%
1 jan 1984 ano
60.913
+0.033
0.05%
1 jan 1995 ano
89.531
+28.618
46.98%
1 jan 1996 ano
89.548
+0.017
0.02%
1 jan 1997 ano
89.613
+0.065
0.07%
1 jan 1998 ano
89.006
-0.608
-0.68%
1 jan 2000 ano
87.812
-1.193
-1.34%
1 jan 2001 ano
88.046
+0.234
0.27%
1 jan 2002 ano
88.309
+0.263
0.3%
1 jan 2003 ano
91.673
+3.363
3.81%
1 jan 2004 ano
92.804
+1.131
1.23%
1 jan 2005 ano
93.008
+0.203
0.22%
1 jan 2006 ano
94.102
+1.094
1.18%
1 jan 2007 ano
94.059
-0.043
-0.05%
1 jan 2008 ano
95.1
+1.041
1.11%
1 jan 2009 ano
95.804
+0.704
0.74%
1 jan 2010 ano
95.53
-0.274
-0.29%
1 jan 2011 ano
88.834
-6.696
-7.01%
1 jan 2012 ano
89.683
+0.85
0.96%
1 jan 2013 ano
91.832
+2.148
2.4%
1 jan 2014 ano
93.172
+1.341
1.46%
1 jan 2015 ano
94.715
+1.543
1.66%
Classificação de países por estatísticas atuais por anos


Comentários: