29
/pt/
pt
AIzaSyAYiBZKx7MnpbEhh9jyipgxe19OcubqV5w
April 1, 2024
121795
Dominican Republic
DOM
true
2
1
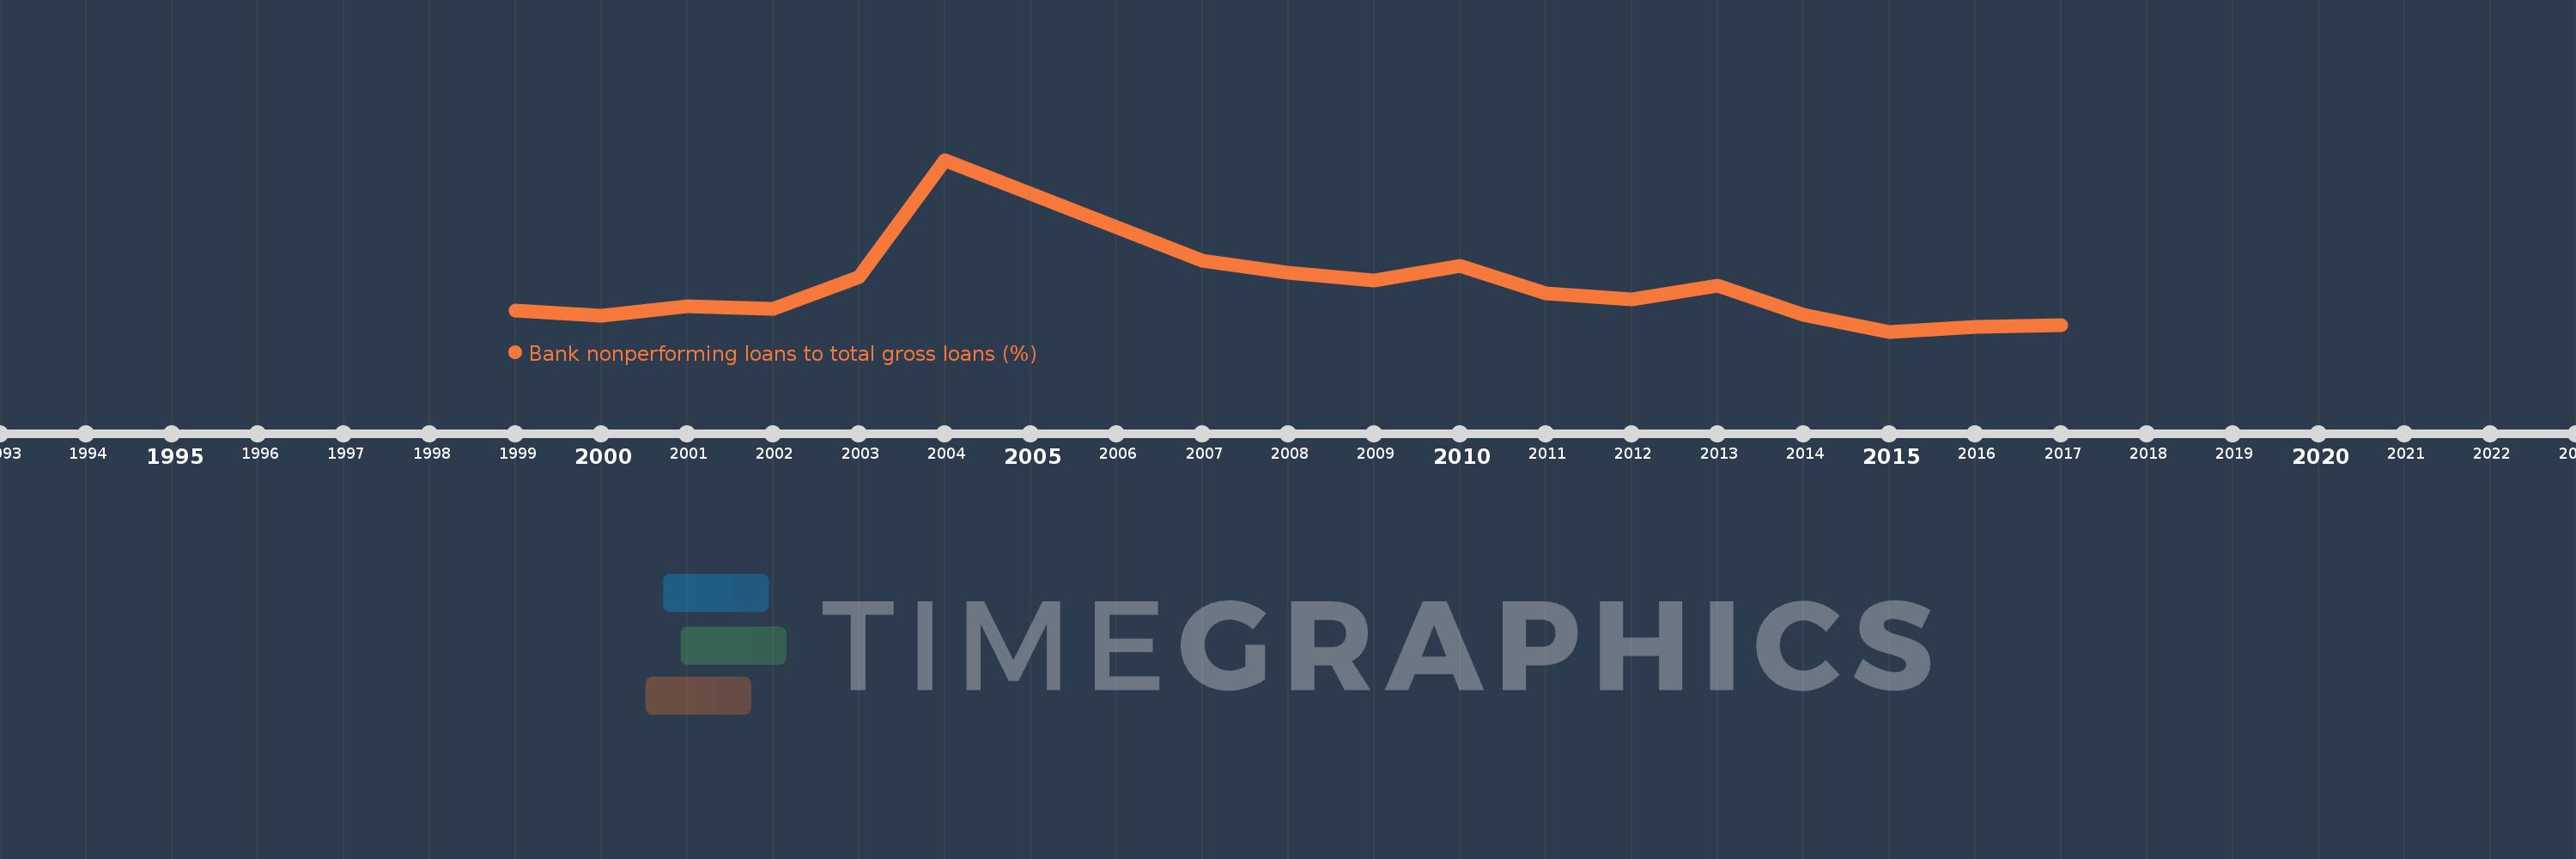
Bank nonperforming loans to total gross loans (%)
2017,2016,2015,2014,2013,2012,2011,2010,2009,2008,2007,2006,2005,2004,2003,2002,2001,2000,1999
Estas estatísticas em outros países:
Linha do tempo:
Nesta escala de tempo está apresentado um gráfico de 1999 ano até 2017 ano Dominican Republic. Dados de 1998 ano ausente. O número de observações reais por data: 19.
Fonte (nome):
Indicadores de desenvolvimento mundial
Fonte (organização):
International Monetary Fund, Global Financial Stability Report.
Categorias:
Financial Sector
Foi atualizado:
23 abr 2017 ano
Indicadores de alterações dos valores ao longo dos anos
Mínimo:
1.536
1 jan 2015 ano
Na data de observação
Valor
Mudança absoluta
A alteração em relação ao valor anterior
1 jan 1999 ano
2.4
+2.4
0.0%
1 jan 2000 ano
2.2
-0.2
-8.33%
1 jan 2001 ano
2.6
+0.4
18.18%
1 jan 2002 ano
2.5
-0.1
-3.85%
1 jan 2003 ano
3.8
+1.3
52.0%
1 jan 2004 ano
8.7
+4.9
128.95%
1 jan 2005 ano
7.3
-1.4
-16.09%
1 jan 2006 ano
5.9
-1.4
-19.18%
1 jan 2007 ano
4.5
-1.4
-23.73%
1 jan 2008 ano
4.0
-0.5
-11.11%
1 jan 2009 ano
3.67
-0.33
-8.26%
1 jan 2010 ano
4.274
+0.604
16.47%
1 jan 2011 ano
3.129
-1.145
-26.79%
1 jan 2012 ano
2.871
-0.259
-8.26%
1 jan 2013 ano
3.455
+0.584
20.35%
1 jan 2014 ano
2.252
-1.203
-34.82%
1 jan 2015 ano
1.536
-0.715
-31.77%
1 jan 2016 ano
1.726
+0.189
12.33%
1 jan 2017 ano
1.81
+0.084
4.85%
Classificação de países por estatísticas atuais por anos


Comentários: