29
/it/
it
AIzaSyAYiBZKx7MnpbEhh9jyipgxe19OcubqV5w
April 1, 2024
96998
Cabo Verde
CPV
true
2
1
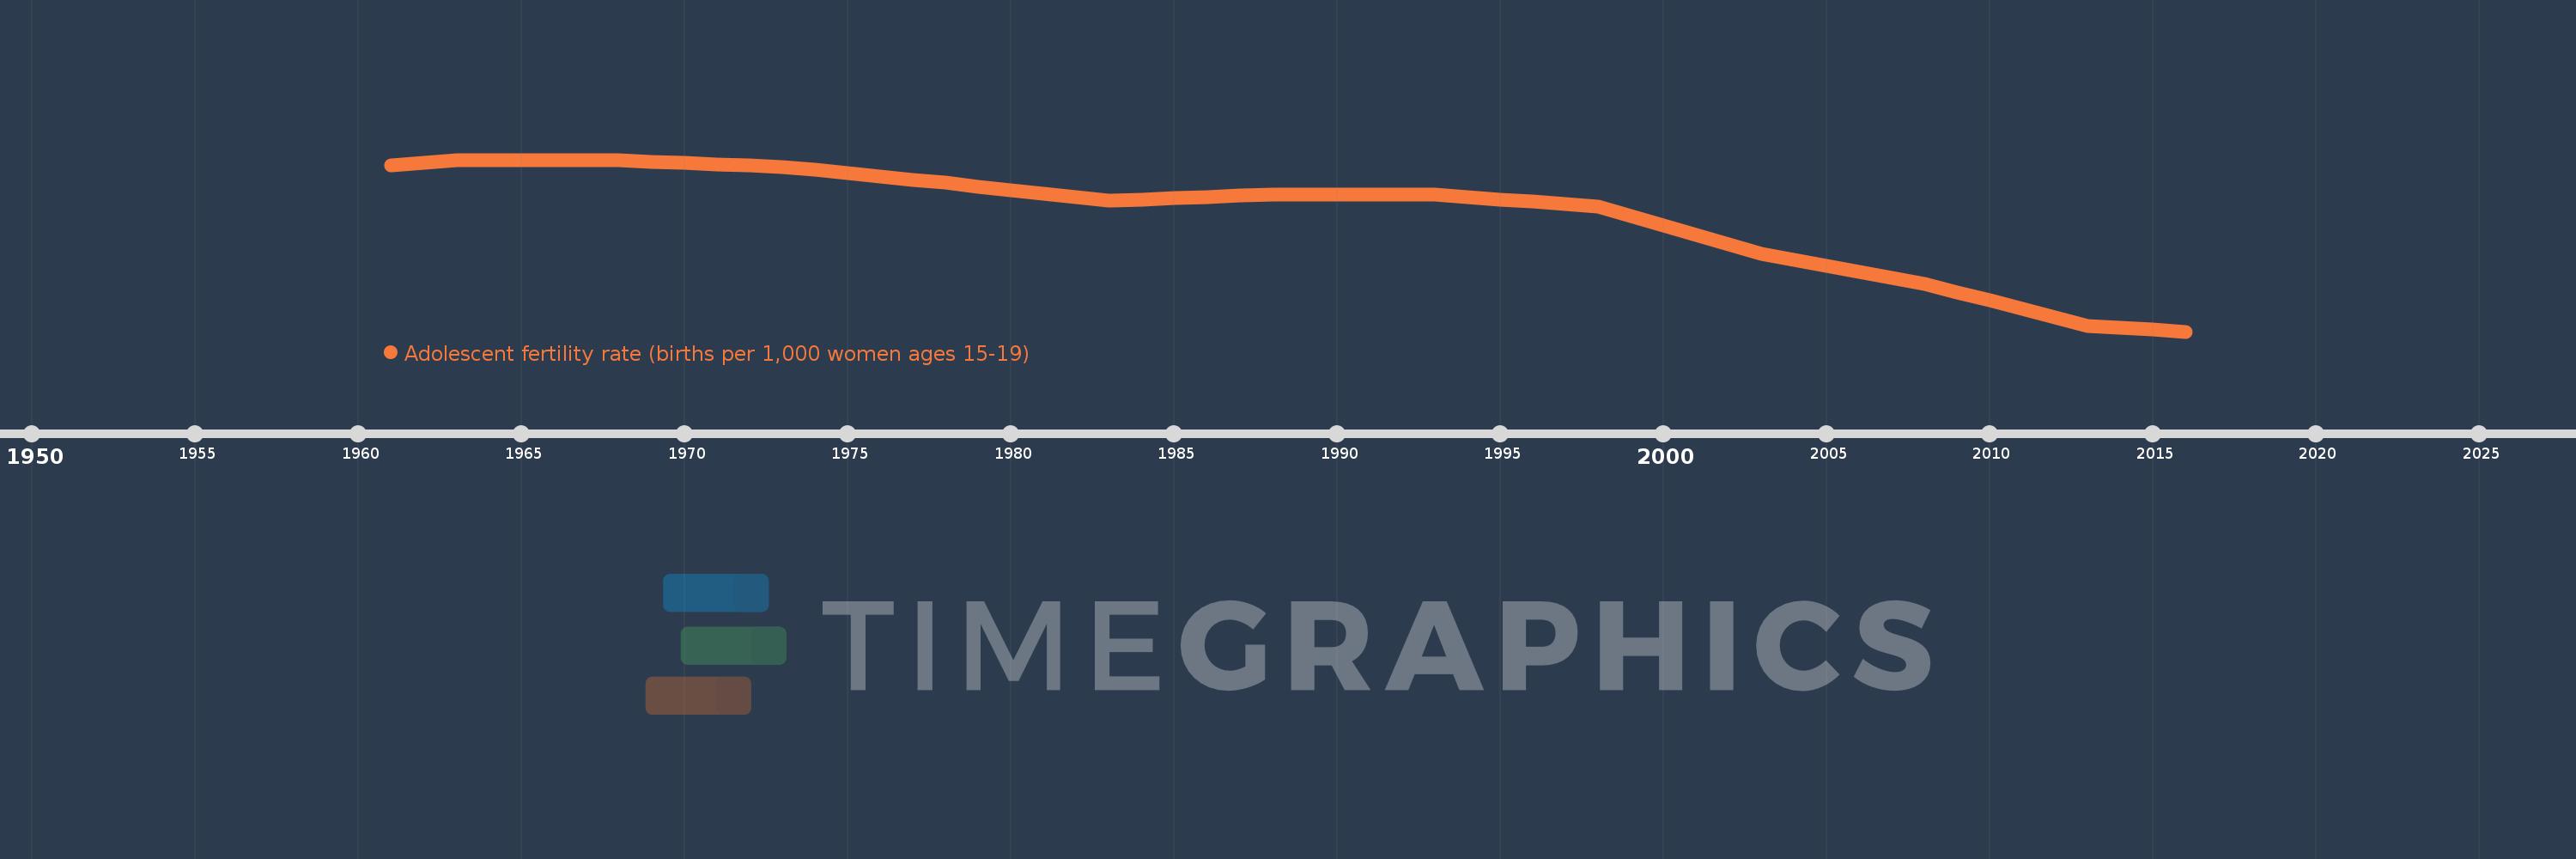
Adolescent fertility rate (births per 1,000 women ages 15-19)
2016,2015,2014,2013,2012,2011,2010,2009,2008,2007,2006,2005,2004,2003,2002,2001,2000,1999,1998,1997,1996,1995,1994,1993,1992,1991,1990,1989,1988,1987,1986,1985,1984,1983,1982,1981,1980,1979,1978,1977,1976,1975,1974,1973,1972,1971,1970,1969,1968,1967,1966,1965,1964,1963,1962,1961
Queste statistiche in altri paesi:
AfghanistanAlbaniaAlgeriaAngolaAntigua and BarbudaArab WorldArgentinaArmeniaArubaAustraliaAustriaAzerbaijanBahamas, TheBahrainBangladeshBarbadosBelarusBelgiumBelizeBeninBhutanBoliviaBosnia and HerzegovinaBotswanaBrazilBrunei DarussalamBulgariaBurkina FasoBurundiCabo VerdeCambodiaCameroonCanadaCaribbean small statesCentral African RepublicCentral Europe and the BalticsChadChannel IslandsChileChinaColombiaComorosCongo, Dem. Rep.Congo, Rep.Costa RicaCote d'IvoireCroatiaCubaCuracaoCyprusCzech RepublicDenmarkDjiboutiDominican RepublicEarly-demographic dividendEast Asia & PacificEast Asia & Pacific (excluding high income)East Asia & Pacific (IDA & IBRD countries)EcuadorEgypt, Arab Rep.El SalvadorEquatorial GuineaEritreaEstoniaEthiopiaEuro areaEurope & Central AsiaEurope & Central Asia (excluding high income)Europe & Central Asia (IDA & IBRD countries)European UnionFijiFinlandFragile and conflict affected situationsFranceFrench PolynesiaGabonGambia, TheGeorgiaGermanyGhanaGreeceGrenadaGuamGuatemalaGuineaGuinea-BissauGuyanaHaitiHeavily indebted poor countries (HIPC)High incomeHondurasHong Kong SAR, ChinaHungaryIBRD onlyIcelandIDA & IBRD totalIDA blendIDA onlyIDA totalIndiaIndonesiaIran, Islamic Rep.IraqIrelandIsraelItalyJamaicaJapanJordanKazakhstanKenyaKiribatiKorea, Dem. People’s Rep.Korea, Rep.KuwaitKyrgyz RepublicLao PDRLate-demographic dividendLatin America & Caribbean Latin America & Caribbean (excluding high income)Latin America & the Caribbean (IDA & IBRD countries)LatviaLeast developed countries: UN classificationLebanonLesothoLiberiaLibyaLithuaniaLow & middle incomeLow incomeLower middle incomeLuxembourgMacao SAR, ChinaMacedonia, FYRMadagascarMalawiMalaysiaMaldivesMaliMaltaMauritaniaMauritiusMexicoMicronesia, Fed. Sts.Middle East & North AfricaMiddle East & North Africa (excluding high income)Middle East & North Africa (IDA & IBRD countries)Middle incomeMoldovaMongoliaMontenegroMoroccoMozambiqueMyanmarNamibiaNepalNetherlandsNew CaledoniaNew ZealandNicaraguaNigerNigeriaNorth AmericaNorwayOECD membersOmanOther small statesPacific island small statesPakistanPanamaPapua New GuineaParaguayPeruPhilippinesPolandPortugalPost-demographic dividendPre-demographic dividendPuerto RicoQatarRomaniaRussian FederationRwandaSamoaSao Tome and PrincipeSaudi ArabiaSenegalSerbiaSeychellesSierra LeoneSingaporeSlovak RepublicSloveniaSmall statesSolomon IslandsSomaliaSouth AfricaSouth AsiaSouth Asia (IDA & IBRD)South SudanSpainSri LankaSt. LuciaSt. Vincent and the GrenadinesSub-Saharan Africa Sub-Saharan Africa (excluding high income)Sub-Saharan Africa (IDA & IBRD countries)SudanSurinameSwazilandSwedenSwitzerlandSyrian Arab RepublicTajikistanTanzaniaThailandTimor-LesteTogoTongaTrinidad and TobagoTunisiaTurkeyTurkmenistanUgandaUkraineUnited Arab EmiratesUnited KingdomUnited StatesUpper middle incomeUruguayUzbekistanVanuatuVenezuela, RBVietnamVirgin Islands (U.S.)West Bank and GazaWorldYemen, Rep.ZambiaZimbabwe Linea del tempo:
Questa scala temporale mostra un grafico dal 1961 anno al 2016 anno. Cabo Verde. I dati fino ad 1960 anno non disponibili. Il numero di osservazioni attuali secondo i date: 56.
La fonte (nome):
Indicatori dello sviluppo mondiale
La fonte (organizzazione):
United Nations Population Division, World Population Prospects.
Categorie:
Health, Gender, Social Development
sono stati aggiornati
23 apr 2017 anni
Indicatori delle variazioni dei valori per anni
Minima:
73.156
1 gen 2016 anni
Massimo:
118.051
1 gen 1963 anni
Alla data di osservazione
Valore
Variazione assoluta
La variazione rispetto al valore precedente
1 gen 1961 anni
116.637
+116.637
0.0%
1 gen 1962 anni
117.344
+0.707
0.61%
1 gen 1963 anni
118.051
+0.707
0.6%
1 gen 1964 anni
118.026
-0.025
-0.02%
1 gen 1965 anni
118.001
-0.025
-0.02%
1 gen 1966 anni
117.975
-0.025
-0.02%
1 gen 1967 anni
117.95
-0.025
-0.02%
1 gen 1968 anni
117.925
-0.025
-0.02%
1 gen 1969 anni
117.581
-0.344
-0.29%
1 gen 1970 anni
117.238
-0.344
-0.29%
1 gen 1971 anni
116.894
-0.344
-0.29%
1 gen 1972 anni
116.551
-0.344
-0.29%
1 gen 1973 anni
116.207
-0.344
-0.29%
1 gen 1974 anni
115.364
-0.843
-0.73%
1 gen 1975 anni
114.521
-0.843
-0.73%
1 gen 1976 anni
113.679
-0.843
-0.74%
1 gen 1977 anni
112.836
-0.843
-0.74%
1 gen 1978 anni
111.993
-0.843
-0.75%
1 gen 1979 anni
111.052
-0.941
-0.84%
1 gen 1980 anni
110.111
-0.941
-0.85%
1 gen 1981 anni
109.17
-0.941
-0.85%
1 gen 1982 anni
108.229
-0.941
-0.86%
1 gen 1983 anni
107.288
-0.941
-0.87%
1 gen 1984 anni
107.633
+0.345
0.32%
1 gen 1985 anni
107.978
+0.345
0.32%
1 gen 1986 anni
108.323
+0.345
0.32%
1 gen 1987 anni
108.668
+0.345
0.32%
1 gen 1988 anni
109.013
+0.345
0.32%
1 gen 1989 anni
109.005
-0.008
-0.01%
1 gen 1990 anni
108.996
-0.008
-0.01%
1 gen 1991 anni
108.988
-0.008
-0.01%
1 gen 1992 anni
108.979
-0.008
-0.01%
1 gen 1993 anni
108.971
-0.008
-0.01%
1 gen 1994 anni
108.334
-0.637
-0.58%
1 gen 1995 anni
107.697
-0.637
-0.59%
1 gen 1996 anni
107.061
-0.637
-0.59%
1 gen 1997 anni
106.424
-0.637
-0.59%
1 gen 1998 anni
105.787
-0.637
-0.6%
1 gen 1999 anni
103.331
-2.456
-2.32%
1 gen 2000 anni
100.874
-2.456
-2.38%
1 gen 2001 anni
98.418
-2.456
-2.44%
1 gen 2002 anni
95.961
-2.456
-2.5%
1 gen 2003 anni
93.505
-2.456
-2.56%
1 gen 2004 anni
91.931
-1.574
-1.68%
1 gen 2005 anni
90.358
-1.574
-1.71%
1 gen 2006 anni
88.784
-1.574
-1.74%
1 gen 2007 anni
87.211
-1.574
-1.77%
1 gen 2008 anni
85.637
-1.574
-1.8%
1 gen 2009 anni
83.44
-2.197
-2.57%
1 gen 2010 anni
81.243
-2.197
-2.63%
1 gen 2011 anni
79.045
-2.197
-2.7%
1 gen 2012 anni
76.848
-2.197
-2.78%
1 gen 2013 anni
74.651
-2.197
-2.86%
1 gen 2014 anni
74.153
-0.498
-0.67%
1 gen 2015 anni
73.655
-0.498
-0.67%
1 gen 2016 anni
73.156
-0.498
-0.68%
Classificazione dei paesi secondo i statistiche attuali per anni


Commenti: