29
/it/
it
AIzaSyAYiBZKx7MnpbEhh9jyipgxe19OcubqV5w
April 1, 2024
179731
Libya
LBY
true
2
1
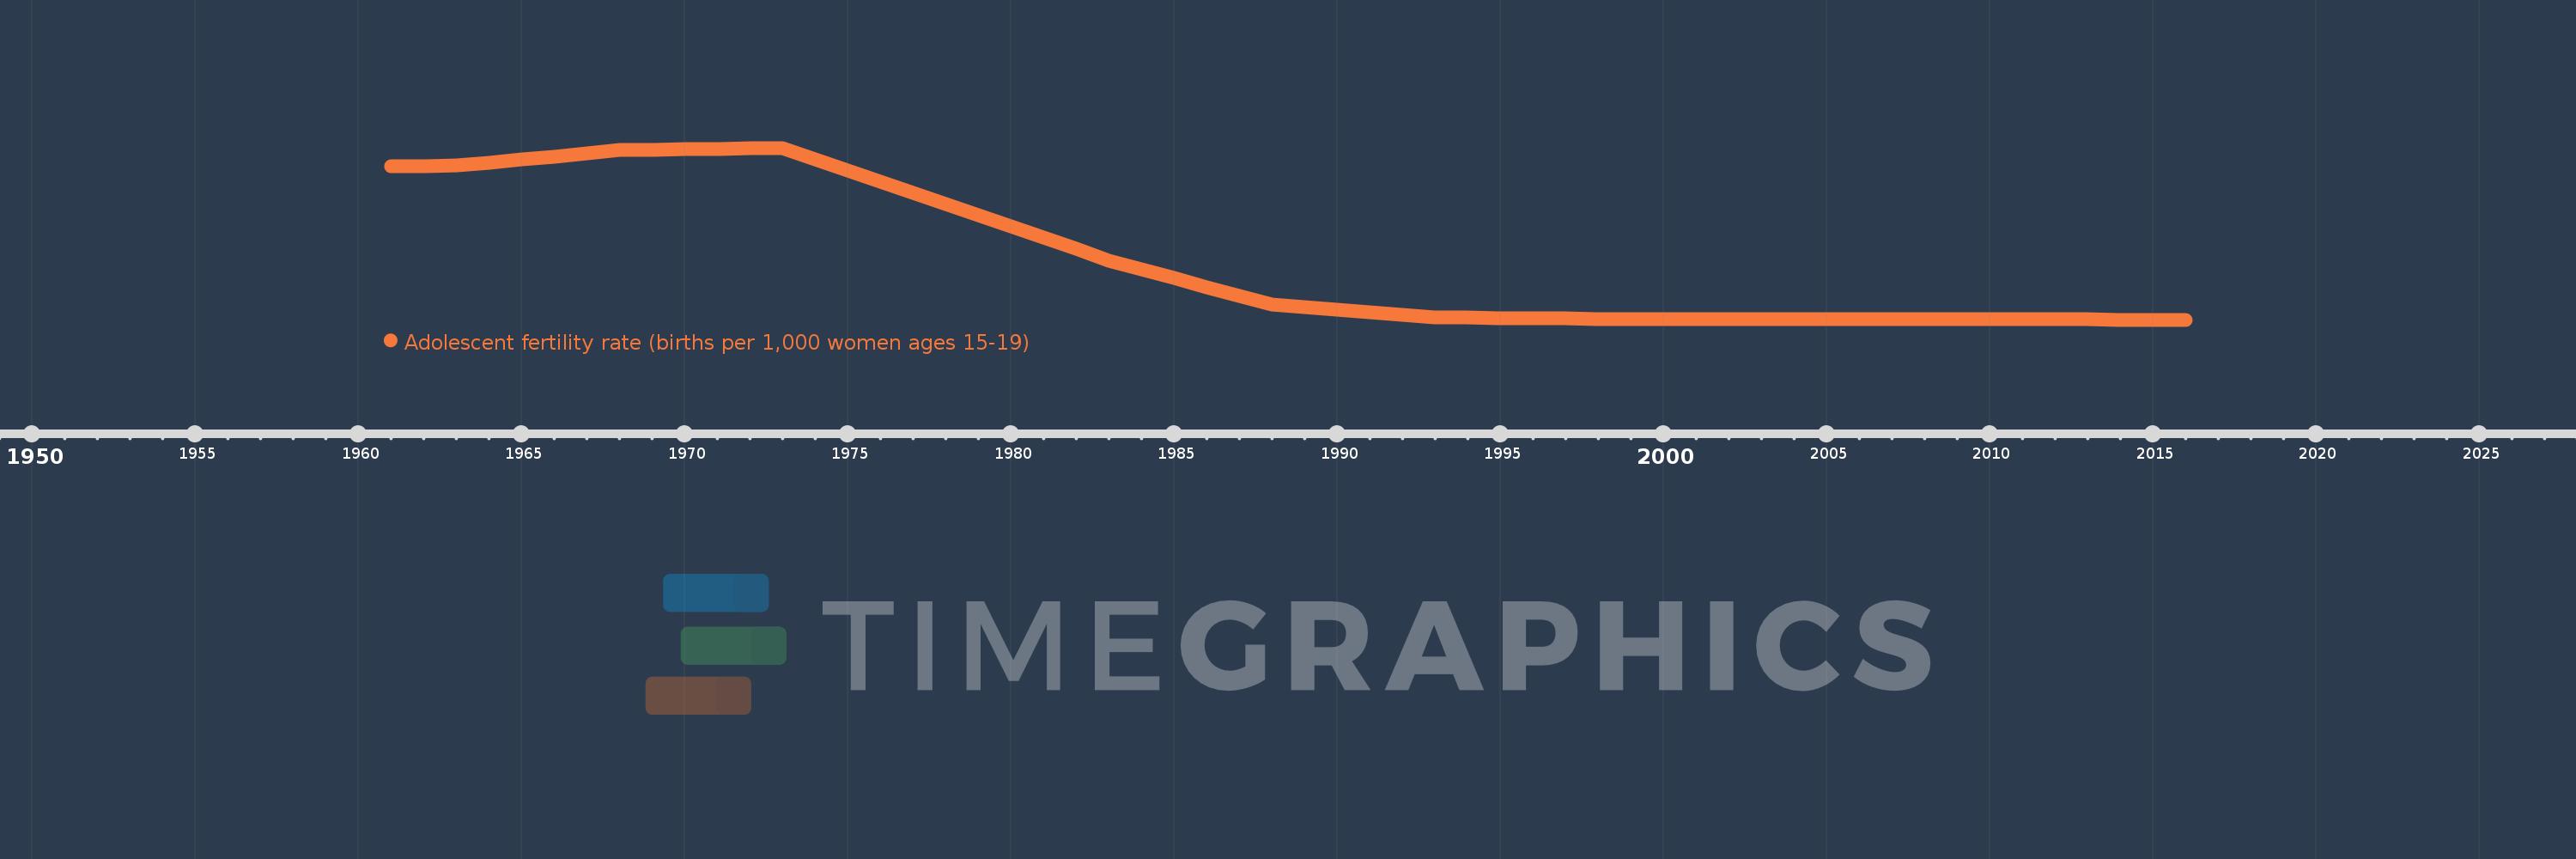
Adolescent fertility rate (births per 1,000 women ages 15-19)
2016,2015,2014,2013,2012,2011,2010,2009,2008,2007,2006,2005,2004,2003,2002,2001,2000,1999,1998,1997,1996,1995,1994,1993,1992,1991,1990,1989,1988,1987,1986,1985,1984,1983,1982,1981,1980,1979,1978,1977,1976,1975,1974,1973,1972,1971,1970,1969,1968,1967,1966,1965,1964,1963,1962,1961
Queste statistiche in altri paesi:
AfghanistanAlbaniaAlgeriaAngolaAntigua and BarbudaArab WorldArgentinaArmeniaArubaAustraliaAustriaAzerbaijanBahamas, TheBahrainBangladeshBarbadosBelarusBelgiumBelizeBeninBhutanBoliviaBosnia and HerzegovinaBotswanaBrazilBrunei DarussalamBulgariaBurkina FasoBurundiCabo VerdeCambodiaCameroonCanadaCaribbean small statesCentral African RepublicCentral Europe and the BalticsChadChannel IslandsChileChinaColombiaComorosCongo, Dem. Rep.Congo, Rep.Costa RicaCote d'IvoireCroatiaCubaCuracaoCyprusCzech RepublicDenmarkDjiboutiDominican RepublicEarly-demographic dividendEast Asia & PacificEast Asia & Pacific (excluding high income)East Asia & Pacific (IDA & IBRD countries)EcuadorEgypt, Arab Rep.El SalvadorEquatorial GuineaEritreaEstoniaEthiopiaEuro areaEurope & Central AsiaEurope & Central Asia (excluding high income)Europe & Central Asia (IDA & IBRD countries)European UnionFijiFinlandFragile and conflict affected situationsFranceFrench PolynesiaGabonGambia, TheGeorgiaGermanyGhanaGreeceGrenadaGuamGuatemalaGuineaGuinea-BissauGuyanaHaitiHeavily indebted poor countries (HIPC)High incomeHondurasHong Kong SAR, ChinaHungaryIBRD onlyIcelandIDA & IBRD totalIDA blendIDA onlyIDA totalIndiaIndonesiaIran, Islamic Rep.IraqIrelandIsraelItalyJamaicaJapanJordanKazakhstanKenyaKiribatiKorea, Dem. People’s Rep.Korea, Rep.KuwaitKyrgyz RepublicLao PDRLate-demographic dividendLatin America & Caribbean Latin America & Caribbean (excluding high income)Latin America & the Caribbean (IDA & IBRD countries)LatviaLeast developed countries: UN classificationLebanonLesothoLiberiaLibyaLithuaniaLow & middle incomeLow incomeLower middle incomeLuxembourgMacao SAR, ChinaMacedonia, FYRMadagascarMalawiMalaysiaMaldivesMaliMaltaMauritaniaMauritiusMexicoMicronesia, Fed. Sts.Middle East & North AfricaMiddle East & North Africa (excluding high income)Middle East & North Africa (IDA & IBRD countries)Middle incomeMoldovaMongoliaMontenegroMoroccoMozambiqueMyanmarNamibiaNepalNetherlandsNew CaledoniaNew ZealandNicaraguaNigerNigeriaNorth AmericaNorwayOECD membersOmanOther small statesPacific island small statesPakistanPanamaPapua New GuineaParaguayPeruPhilippinesPolandPortugalPost-demographic dividendPre-demographic dividendPuerto RicoQatarRomaniaRussian FederationRwandaSamoaSao Tome and PrincipeSaudi ArabiaSenegalSerbiaSeychellesSierra LeoneSingaporeSlovak RepublicSloveniaSmall statesSolomon IslandsSomaliaSouth AfricaSouth AsiaSouth Asia (IDA & IBRD)South SudanSpainSri LankaSt. LuciaSt. Vincent and the GrenadinesSub-Saharan Africa Sub-Saharan Africa (excluding high income)Sub-Saharan Africa (IDA & IBRD countries)SudanSurinameSwazilandSwedenSwitzerlandSyrian Arab RepublicTajikistanTanzaniaThailandTimor-LesteTogoTongaTrinidad and TobagoTunisiaTurkeyTurkmenistanUgandaUkraineUnited Arab EmiratesUnited KingdomUnited StatesUpper middle incomeUruguayUzbekistanVanuatuVenezuela, RBVietnamVirgin Islands (U.S.)West Bank and GazaWorldYemen, Rep.ZambiaZimbabwe Linea del tempo:
Questa scala temporale mostra un grafico dal 1961 anno al 2016 anno. Libya. I dati fino ad 1960 anno non disponibili. Il numero di osservazioni attuali secondo i date: 56.
La fonte (nome):
Indicatori dello sviluppo mondiale
La fonte (organizzazione):
United Nations Population Division, World Population Prospects.
Categorie:
Health, Gender, Social Development
sono stati aggiornati
23 apr 2017 anni
Indicatori delle variazioni dei valori per anni
Minima:
6.158
1 gen 2016 anni
Massimo:
131.999
1 gen 1973 anni
Alla data di osservazione
Valore
Variazione assoluta
La variazione rispetto al valore precedente
1 gen 1961 anni
118.31
+118.31
0.0%
1 gen 1962 anni
118.636
+0.326
0.28%
1 gen 1963 anni
118.962
+0.326
0.27%
1 gen 1964 anni
121.217
+2.255
1.9%
1 gen 1965 anni
123.473
+2.255
1.86%
1 gen 1966 anni
125.728
+2.255
1.83%
1 gen 1967 anni
127.984
+2.255
1.79%
1 gen 1968 anni
130.239
+2.255
1.76%
1 gen 1969 anni
130.591
+0.352
0.27%
1 gen 1970 anni
130.943
+0.352
0.27%
1 gen 1971 anni
131.295
+0.352
0.27%
1 gen 1972 anni
131.647
+0.352
0.27%
1 gen 1973 anni
131.999
+0.352
0.27%
1 gen 1974 anni
123.791
-8.208
-6.22%
1 gen 1975 anni
115.582
-8.208
-6.63%
1 gen 1976 anni
107.374
-8.208
-7.1%
1 gen 1977 anni
99.165
-8.208
-7.64%
1 gen 1978 anni
90.957
-8.208
-8.28%
1 gen 1979 anni
82.69
-8.267
-9.09%
1 gen 1980 anni
74.423
-8.267
-10.0%
1 gen 1981 anni
66.157
-8.267
-11.11%
1 gen 1982 anni
57.89
-8.267
-12.5%
1 gen 1983 anni
49.623
-8.267
-14.28%
1 gen 1984 anni
43.116
-6.507
-13.11%
1 gen 1985 anni
36.61
-6.507
-15.09%
1 gen 1986 anni
30.103
-6.507
-17.77%
1 gen 1987 anni
23.597
-6.507
-21.61%
1 gen 1988 anni
17.09
-6.507
-27.57%
1 gen 1989 anni
15.223
-1.867
-10.92%
1 gen 1990 anni
13.356
-1.867
-12.26%
1 gen 1991 anni
11.49
-1.867
-13.98%
1 gen 1992 anni
9.623
-1.867
-16.25%
1 gen 1993 anni
7.756
-1.867
-19.4%
1 gen 1994 anni
7.557
-0.199
-2.57%
1 gen 1995 anni
7.358
-0.199
-2.64%
1 gen 1996 anni
7.158
-0.199
-2.71%
1 gen 1997 anni
6.959
-0.199
-2.78%
1 gen 1998 anni
6.76
-0.199
-2.86%
1 gen 1999 anni
6.728
-0.032
-0.47%
1 gen 2000 anni
6.696
-0.032
-0.48%
1 gen 2001 anni
6.664
-0.032
-0.48%
1 gen 2002 anni
6.632
-0.032
-0.48%
1 gen 2003 anni
6.6
-0.032
-0.48%
1 gen 2004 anni
6.61
+0.01
0.15%
1 gen 2005 anni
6.62
+0.01
0.15%
1 gen 2006 anni
6.63
+0.01
0.15%
1 gen 2007 anni
6.64
+0.01
0.15%
1 gen 2008 anni
6.65
+0.01
0.15%
1 gen 2009 anni
6.585
-0.065
-0.98%
1 gen 2010 anni
6.52
-0.065
-0.99%
1 gen 2011 anni
6.455
-0.065
-1.0%
1 gen 2012 anni
6.39
-0.065
-1.01%
1 gen 2013 anni
6.325
-0.065
-1.02%
1 gen 2014 anni
6.269
-0.056
-0.88%
1 gen 2015 anni
6.214
-0.056
-0.89%
1 gen 2016 anni
6.158
-0.056
-0.89%
Classificazione dei paesi secondo i statistiche attuali per anni


Commenti: