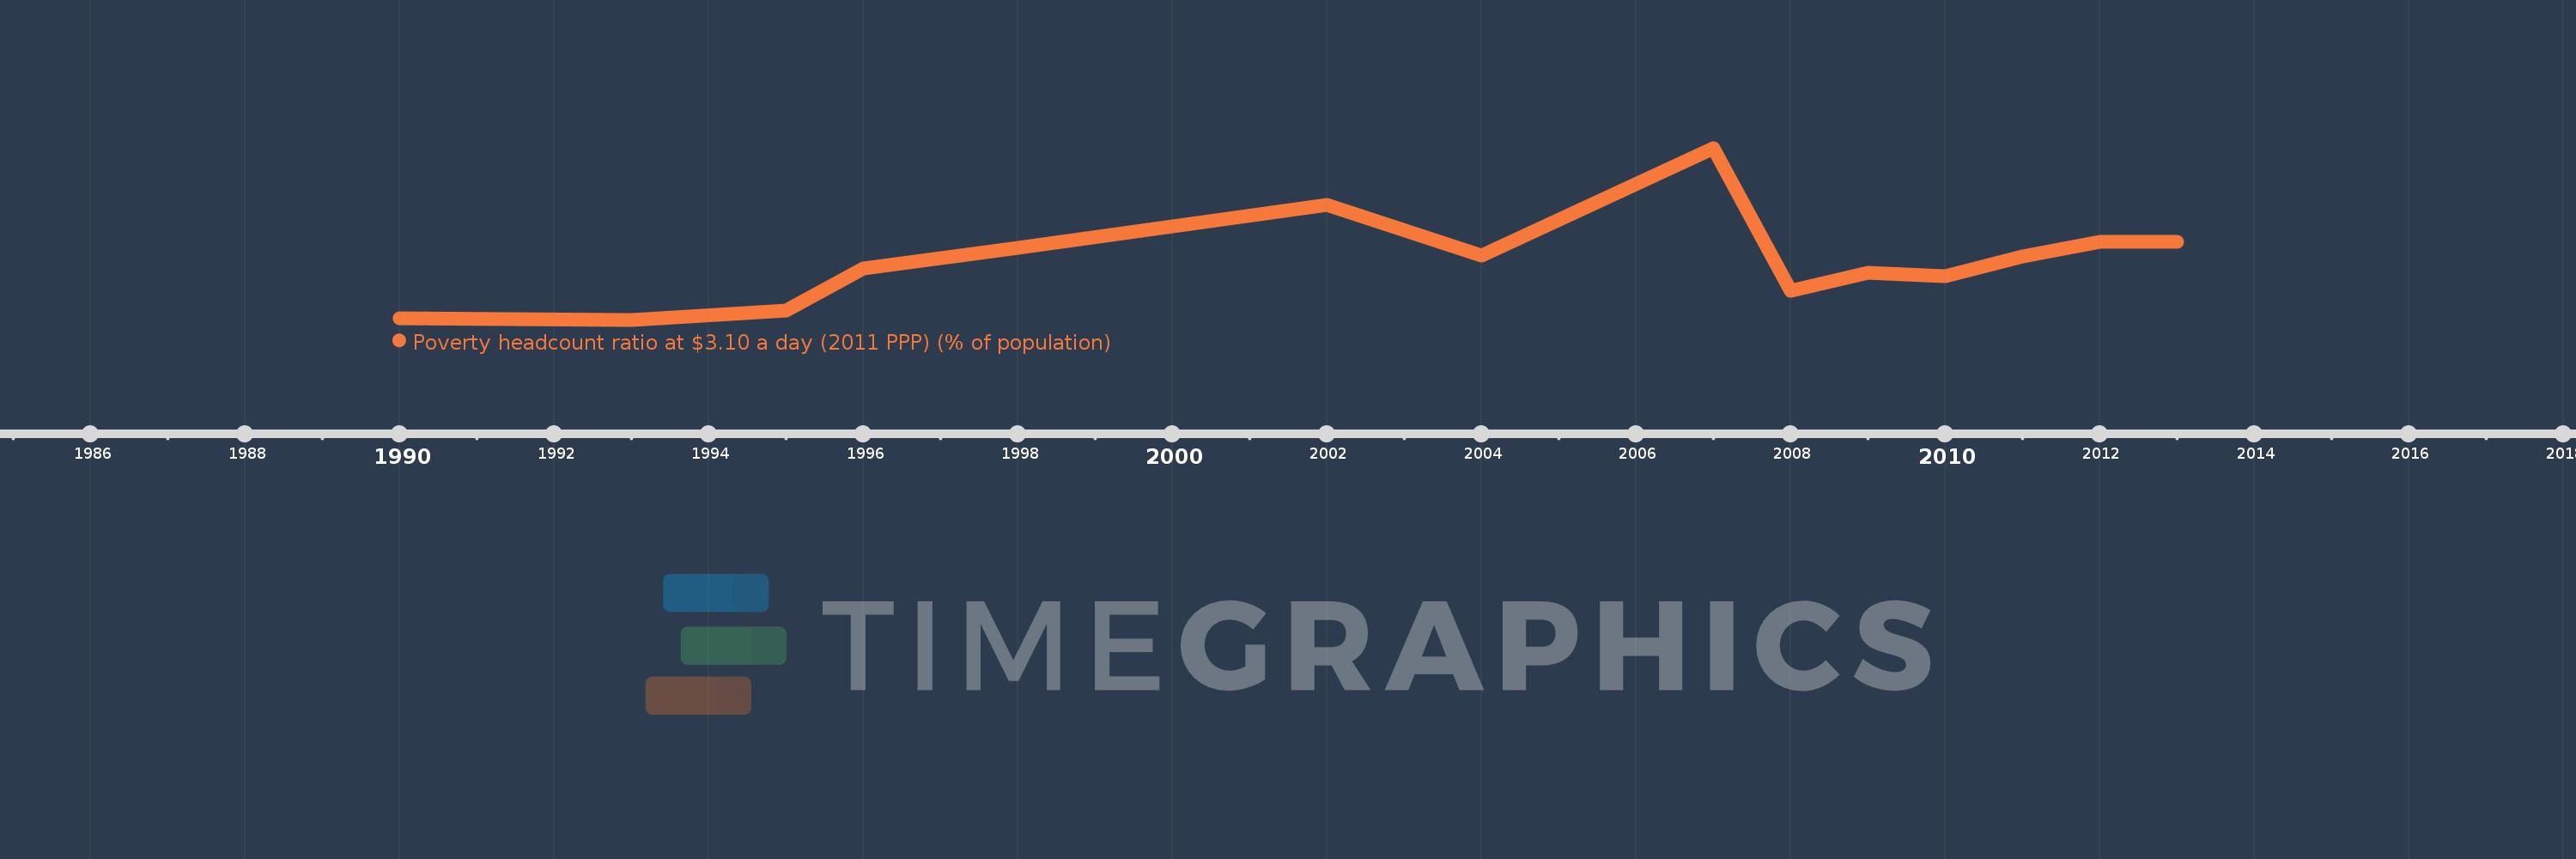
Questa scala temporale mostra un grafico dal 1990 anno al 2013 anno. Bulgaria. I dati fino ad 1989 anno non disponibili. Il numero di osservazioni attuali secondo i date: 14.
La fonte (nome):
Indicatori dello sviluppo mondiale
La fonte (organizzazione):
World Bank, Development Research Group. Data are based on primary household survey data obtained from government statistical agencies and World Bank country departments. Data for high-income economies are from the Luxembourg Income Study database. For more information and methodology, please see PovcalNet (http://iresearch.worldbank.org/PovcalNet/index.htm).
Categorie:
Poverty
sono stati aggiornati
23 apr 2017 anni
Indicatori delle variazioni dei valori per anni
In media:
3.533
Minima:
0.0
1 gen 1993 anni
Massimo:
10.33
1 gen 2007 anni
Alla data di osservazione
Valore
Variazione assoluta
La variazione rispetto al valore precedente
1 gen 1990 anni
0.08
+0.08
0.0%
1 gen 1993 anni
0.0
-0.08
-100.0%
1 gen 1995 anni
0.54
+0.54
%
1 gen 1996 anni
3.07
+2.53
468.52%
1 gen 1998 anni
4.31
+1.24
40.39%
1 gen 2002 anni
6.9
+2.59
60.09%
1 gen 2004 anni
3.88
-3.02
-43.77%
1 gen 2007 anni
10.33
+6.45
166.24%
1 gen 2008 anni
1.76
-8.57
-82.96%
1 gen 2009 anni
2.82
+1.06
60.23%
1 gen 2010 anni
2.61
-0.21
-7.45%
1 gen 2011 anni
3.8
+1.19
45.59%
1 gen 2012 anni
4.66
+0.86
22.63%
1 gen 2013 anni
4.7
+0.04
0.86%
Classificazione dei paesi secondo i statistiche attuali per anni
