30
/it/
AIzaSyAYiBZKx7MnpbEhh9jyipgxe19OcubqV5w
April 1, 2024
150907
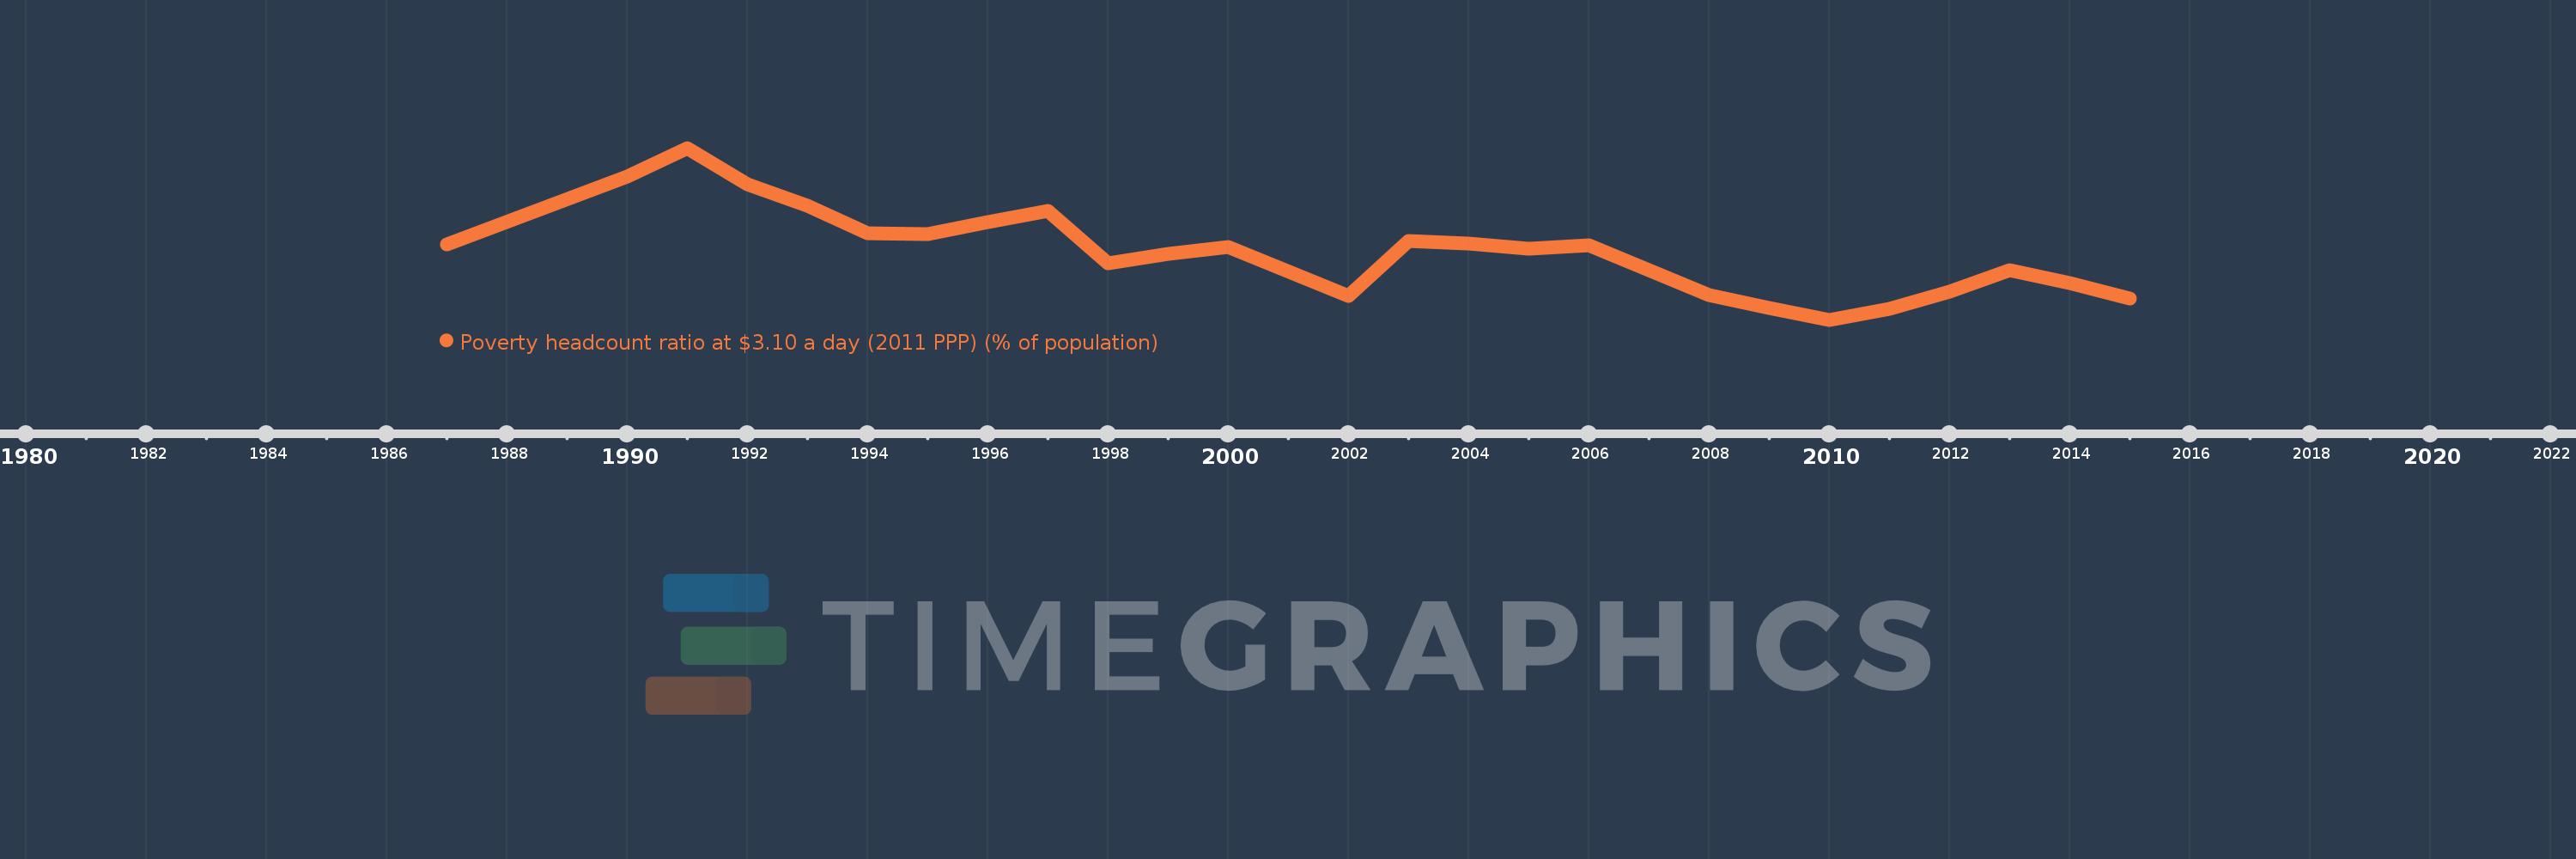
Honduras
HND
true
2
1
Poverty headcount ratio at $3.10 a day (2011 PPP) (% of population)
2015,2014,2013,2012,2011,2010,2009,2008,2007,2006,2005,2004,2003,2002,2000,1999,1998,1997,1996,1995,1994,1993,1992,1991,1990,1987
