29
/it/
it
AIzaSyAYiBZKx7MnpbEhh9jyipgxe19OcubqV5w
April 1, 2024
92562
Brunei Darussalam
BRN
true
2
1
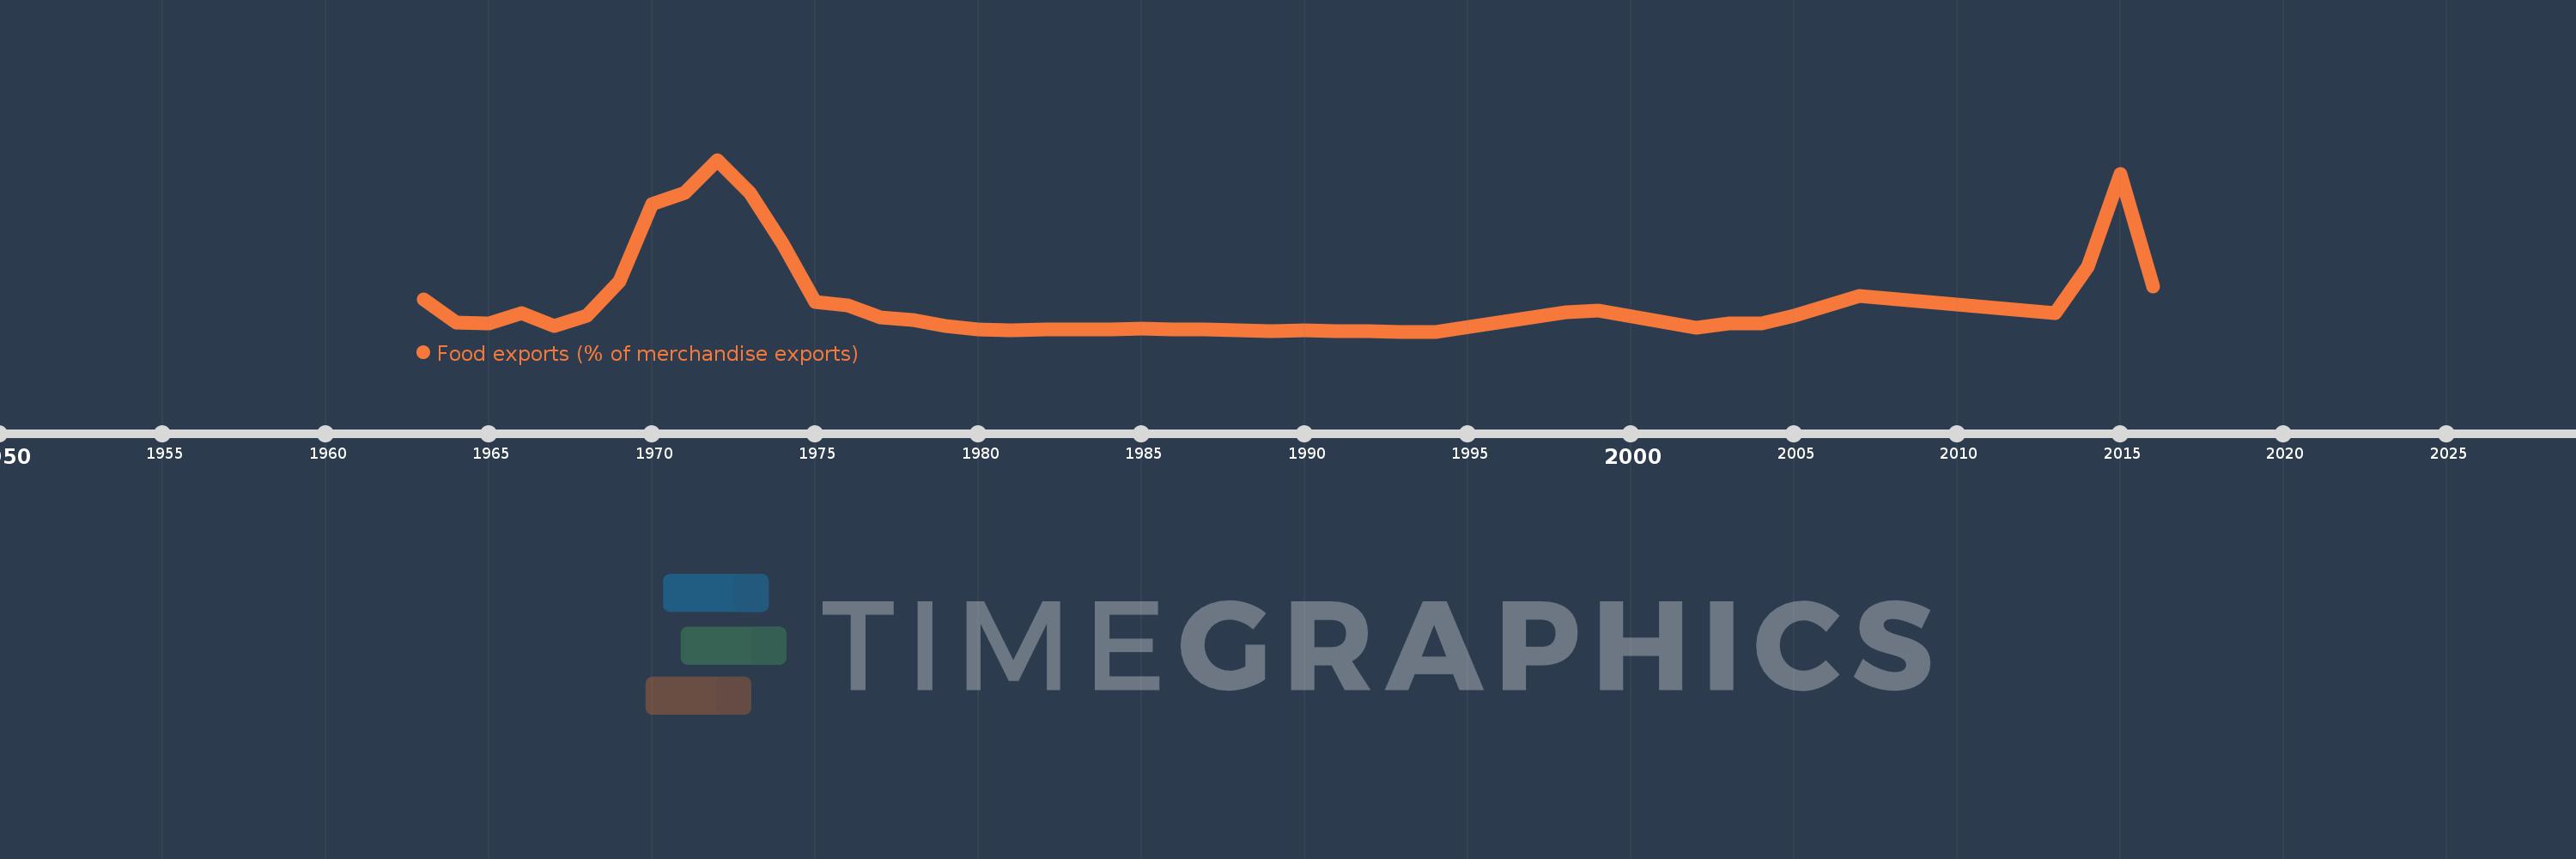
Food exports (% of merchandise exports)
2016,2015,2014,2013,2007,2005,2004,2003,2002,1999,1998,1994,1993,1992,1991,1990,1989,1988,1987,1986,1985,1984,1983,1982,1981,1980,1979,1978,1977,1976,1975,1974,1973,1972,1971,1970,1969,1968,1967,1966,1965,1964,1963
Queste statistiche in altri paesi:
AfghanistanAlbaniaAlgeriaAndorraAngolaAntigua and BarbudaArab WorldArgentinaArmeniaArubaAustraliaAustriaAzerbaijanBahamas, TheBahrainBangladeshBarbadosBelarusBelgiumBelizeBeninBermudaBhutanBoliviaBosnia and HerzegovinaBotswanaBrazilBrunei DarussalamBulgariaBurkina FasoBurundiCabo VerdeCambodiaCameroonCanadaCaribbean small statesCayman IslandsCentral African RepublicCentral Europe and the BalticsChadChileChinaColombiaComorosCongo, Dem. Rep.Congo, Rep.Costa RicaCote d'IvoireCroatiaCubaCyprusCzech RepublicDenmarkDjiboutiDominicaDominican RepublicEarly-demographic dividendEast Asia & PacificEast Asia & Pacific (excluding high income)East Asia & Pacific (IDA & IBRD countries)EcuadorEgypt, Arab Rep.El SalvadorEquatorial GuineaEritreaEstoniaEthiopiaEuro areaEurope & Central AsiaEurope & Central Asia (excluding high income)Europe & Central Asia (IDA & IBRD countries)European UnionFaroe IslandsFijiFinlandFragile and conflict affected situationsFranceFrench PolynesiaGabonGambia, TheGeorgiaGermanyGhanaGreeceGreenlandGrenadaGuatemalaGuineaGuinea-BissauGuyanaHaitiHeavily indebted poor countries (HIPC)High incomeHondurasHong Kong SAR, ChinaHungaryIBRD onlyIcelandIDA & IBRD totalIDA blendIDA onlyIDA totalIndiaIndonesiaIran, Islamic Rep.IraqIrelandIsraelItalyJamaicaJapanJordanKazakhstanKenyaKiribatiKorea, Rep.KuwaitKyrgyz RepublicLao PDRLate-demographic dividendLatin America & Caribbean Latin America & Caribbean (excluding high income)Latin America & the Caribbean (IDA & IBRD countries)LatviaLeast developed countries: UN classificationLebanonLesothoLiberiaLibyaLithuaniaLow & middle incomeLower middle incomeLuxembourgMacao SAR, ChinaMacedonia, FYRMadagascarMalawiMalaysiaMaldivesMaliMaltaMauritaniaMauritiusMexicoMiddle East & North AfricaMiddle East & North Africa (excluding high income)Middle East & North Africa (IDA & IBRD countries)Middle incomeMoldovaMongoliaMoroccoMozambiqueMyanmarNamibiaNepalNetherlandsNew CaledoniaNew ZealandNicaraguaNigerNigeriaNorth AmericaNorwayOECD membersOmanOther small statesPacific island small statesPakistanPalauPanamaPapua New GuineaParaguayPeruPhilippinesPolandPortugalPost-demographic dividendPre-demographic dividendQatarRomaniaRussian FederationRwandaSamoaSao Tome and PrincipeSaudi ArabiaSenegalSerbiaSeychellesSierra LeoneSingaporeSlovak RepublicSloveniaSmall statesSolomon IslandsSomaliaSouth AfricaSouth AsiaSouth Asia (IDA & IBRD)SpainSri LankaSt. Kitts and NevisSt. LuciaSt. Vincent and the GrenadinesSub-Saharan Africa Sub-Saharan Africa (excluding high income)Sub-Saharan Africa (IDA & IBRD countries)SudanSurinameSwazilandSwedenSwitzerlandSyrian Arab RepublicTajikistanTanzaniaThailandTimor-LesteTogoTongaTrinidad and TobagoTunisiaTurkeyTurkmenistanTurks and Caicos IslandsTuvaluUgandaUkraineUnited Arab EmiratesUnited KingdomUnited StatesUpper middle incomeUruguayVanuatuVenezuela, RBVietnamVirgin Islands (U.S.)WorldYemen, Rep.ZambiaZimbabwe Linea del tempo:
Questa scala temporale mostra un grafico dal 1963 anno al 2016 anno. Brunei Darussalam. I dati fino ad 1962 anno non disponibili. Il numero di osservazioni attuali secondo i date: 43.
La fonte (nome):
Indicatori dello sviluppo mondiale
La fonte (organizzazione):
World Bank staff estimates from the Comtrade database maintained by the United Nations Statistics Division.
Categorie:
Private Sector, Trade
sono stati aggiornati
23 apr 2017 anni
Indicatori delle variazioni dei valori per anni
Minima:
0.0
1 gen 1993 anni
Massimo:
0.424
1 gen 1972 anni
Alla data di osservazione
Valore
Variazione assoluta
La variazione rispetto al valore precedente
1 gen 1963 anni
0.079
+0.079
0.0%
1 gen 1964 anni
0.022
-0.057
-72.41%
1 gen 1965 anni
0.02
-0.001
-5.64%
1 gen 1966 anni
0.045
+0.025
122.34%
1 gen 1967 anni
0.014
-0.031
-69.19%
1 gen 1968 anni
0.039
+0.025
177.83%
1 gen 1969 anni
0.123
+0.084
215.68%
1 gen 1970 anni
0.315
+0.192
156.58%
1 gen 1971 anni
0.342
+0.027
8.46%
1 gen 1972 anni
0.424
+0.082
23.9%
1 gen 1973 anni
0.343
-0.081
-19.08%
1 gen 1974 anni
0.218
-0.125
-36.51%
1 gen 1975 anni
0.074
-0.143
-65.77%
1 gen 1976 anni
0.064
-0.011
-14.23%
1 gen 1977 anni
0.036
-0.028
-44.19%
1 gen 1978 anni
0.028
-0.007
-20.54%
1 gen 1979 anni
0.013
-0.015
-52.51%
1 gen 1980 anni
0.006
-0.008
-56.66%
1 gen 1981 anni
0.004
-0.002
-35.37%
1 gen 1982 anni
0.006
+0.002
58.89%
1 gen 1983 anni
0.005
-0.001
-12.92%
1 gen 1984 anni
0.005
0.0
-0.53%
1 gen 1985 anni
0.007
+0.001
28.36%
1 gen 1986 anni
0.006
0.0
-5.14%
1 gen 1987 anni
0.006
0.0
-4.27%
1 gen 1988 anni
0.004
-0.002
-40.93%
1 gen 1989 anni
0.002
-0.001
-38.99%
1 gen 1990 anni
0.003
+0.001
25.91%
1 gen 1991 anni
0.001
-0.002
-67.84%
1 gen 1992 anni
0.001
0.0
-25.68%
1 gen 1993 anni
0.0
0.0
-63.7%
1 gen 1994 anni
0.0
+0.0
20.97%
1 gen 1998 anni
0.048
+0.048
16.66 Mille.%
1 gen 1999 anni
0.051
+0.003
5.87%
1 gen 2002 anni
0.01
-0.041
-79.78%
1 gen 2003 anni
0.02
+0.01
96.41%
1 gen 2004 anni
0.02
0.0
-0.93%
1 gen 2005 anni
0.039
+0.019
94.57%
1 gen 2007 anni
0.089
+0.05
127.24%
1 gen 2013 anni
0.046
-0.043
-48.25%
1 gen 2014 anni
0.16
+0.114
248.7%
1 gen 2015 anni
0.389
+0.229
142.6%
1 gen 2016 anni
0.111
-0.279
-71.6%
Classificazione dei paesi secondo i statistiche attuali per anni


Commenti: