29
/it/
it
AIzaSyAYiBZKx7MnpbEhh9jyipgxe19OcubqV5w
April 1, 2024
266817
Trinidad and Tobago
TTO
true
2
1
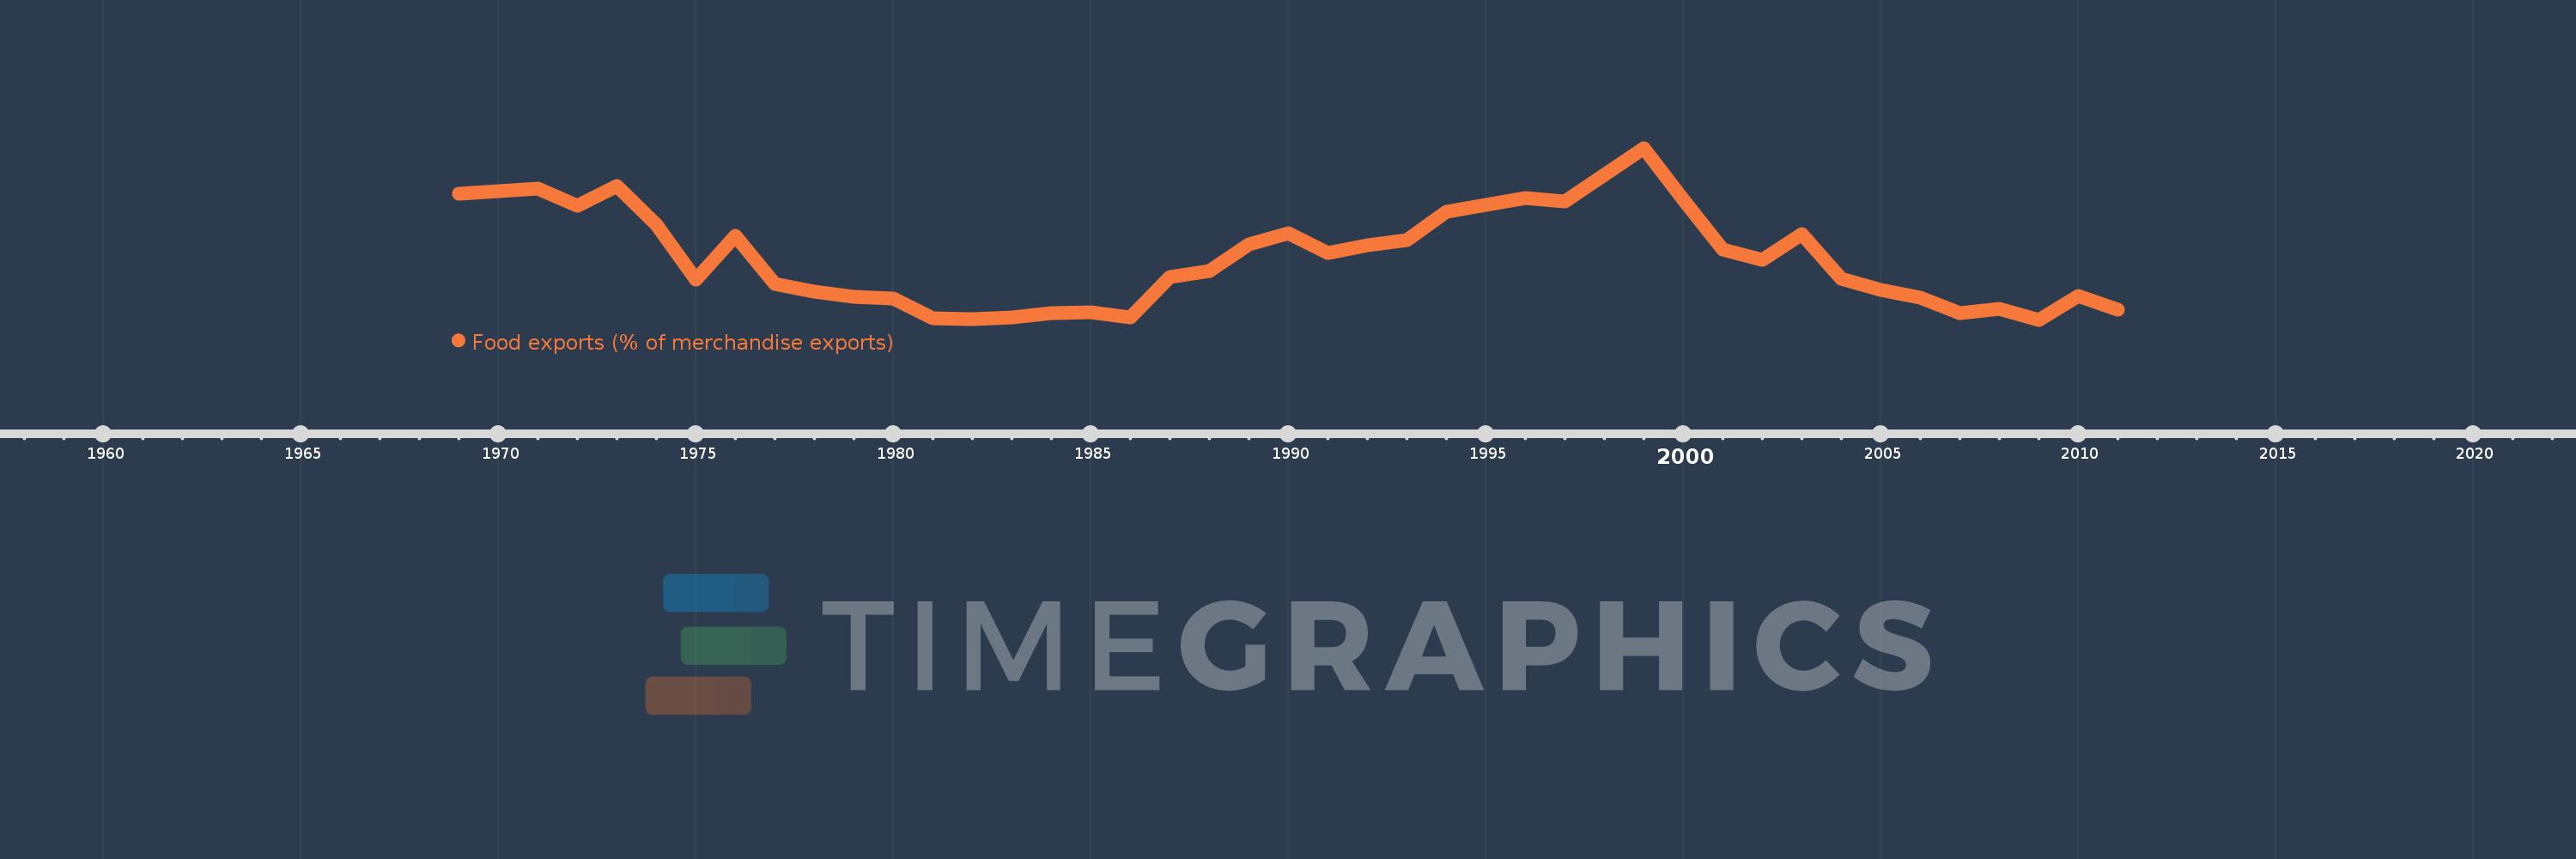
Food exports (% of merchandise exports)
2011,2010,2009,2008,2007,2006,2005,2004,2003,2002,2001,2000,1999,1998,1997,1996,1995,1994,1993,1992,1991,1990,1989,1988,1987,1986,1985,1984,1983,1982,1981,1980,1979,1978,1977,1976,1975,1974,1973,1972,1971,1970,1969
Queste statistiche in altri paesi:
AfghanistanAlbaniaAlgeriaAndorraAngolaAntigua and BarbudaArab WorldArgentinaArmeniaArubaAustraliaAustriaAzerbaijanBahamas, TheBahrainBangladeshBarbadosBelarusBelgiumBelizeBeninBermudaBhutanBoliviaBosnia and HerzegovinaBotswanaBrazilBrunei DarussalamBulgariaBurkina FasoBurundiCabo VerdeCambodiaCameroonCanadaCaribbean small statesCayman IslandsCentral African RepublicCentral Europe and the BalticsChadChileChinaColombiaComorosCongo, Dem. Rep.Congo, Rep.Costa RicaCote d'IvoireCroatiaCubaCyprusCzech RepublicDenmarkDjiboutiDominicaDominican RepublicEarly-demographic dividendEast Asia & PacificEast Asia & Pacific (excluding high income)East Asia & Pacific (IDA & IBRD countries)EcuadorEgypt, Arab Rep.El SalvadorEquatorial GuineaEritreaEstoniaEthiopiaEuro areaEurope & Central AsiaEurope & Central Asia (excluding high income)Europe & Central Asia (IDA & IBRD countries)European UnionFaroe IslandsFijiFinlandFragile and conflict affected situationsFranceFrench PolynesiaGabonGambia, TheGeorgiaGermanyGhanaGreeceGreenlandGrenadaGuatemalaGuineaGuinea-BissauGuyanaHaitiHeavily indebted poor countries (HIPC)High incomeHondurasHong Kong SAR, ChinaHungaryIBRD onlyIcelandIDA & IBRD totalIDA blendIDA onlyIDA totalIndiaIndonesiaIran, Islamic Rep.IraqIrelandIsraelItalyJamaicaJapanJordanKazakhstanKenyaKiribatiKorea, Rep.KuwaitKyrgyz RepublicLao PDRLate-demographic dividendLatin America & Caribbean Latin America & Caribbean (excluding high income)Latin America & the Caribbean (IDA & IBRD countries)LatviaLeast developed countries: UN classificationLebanonLesothoLiberiaLibyaLithuaniaLow & middle incomeLower middle incomeLuxembourgMacao SAR, ChinaMacedonia, FYRMadagascarMalawiMalaysiaMaldivesMaliMaltaMauritaniaMauritiusMexicoMiddle East & North AfricaMiddle East & North Africa (excluding high income)Middle East & North Africa (IDA & IBRD countries)Middle incomeMoldovaMongoliaMoroccoMozambiqueMyanmarNamibiaNepalNetherlandsNew CaledoniaNew ZealandNicaraguaNigerNigeriaNorth AmericaNorwayOECD membersOmanOther small statesPacific island small statesPakistanPalauPanamaPapua New GuineaParaguayPeruPhilippinesPolandPortugalPost-demographic dividendPre-demographic dividendQatarRomaniaRussian FederationRwandaSamoaSao Tome and PrincipeSaudi ArabiaSenegalSerbiaSeychellesSierra LeoneSingaporeSlovak RepublicSloveniaSmall statesSolomon IslandsSomaliaSouth AfricaSouth AsiaSouth Asia (IDA & IBRD)SpainSri LankaSt. Kitts and NevisSt. LuciaSt. Vincent and the GrenadinesSub-Saharan Africa Sub-Saharan Africa (excluding high income)Sub-Saharan Africa (IDA & IBRD countries)SudanSurinameSwazilandSwedenSwitzerlandSyrian Arab RepublicTajikistanTanzaniaThailandTimor-LesteTogoTongaTrinidad and TobagoTunisiaTurkeyTurkmenistanTurks and Caicos IslandsTuvaluUgandaUkraineUnited Arab EmiratesUnited KingdomUnited StatesUpper middle incomeUruguayVanuatuVenezuela, RBVietnamVirgin Islands (U.S.)WorldYemen, Rep.ZambiaZimbabwe Linea del tempo:
Questa scala temporale mostra un grafico dal 1969 anno al 2011 anno. Trinidad and Tobago. I dati fino ad 1968 anno non disponibili. Il numero di osservazioni attuali secondo i date: 43.
La fonte (nome):
Indicatori dello sviluppo mondiale
La fonte (organizzazione):
World Bank staff estimates from the Comtrade database maintained by the United Nations Statistics Division.
Categorie:
Private Sector, Trade
sono stati aggiornati
23 apr 2017 anni
Indicatori delle variazioni dei valori per anni
Minima:
1.985
1 gen 2009 anni
Massimo:
11.016
1 gen 1999 anni
Alla data di osservazione
Valore
Variazione assoluta
La variazione rispetto al valore precedente
1 gen 1969 anni
8.596
+8.596
0.0%
1 gen 1970 anni
8.733
+0.137
1.59%
1 gen 1971 anni
8.888
+0.154
1.77%
1 gen 1972 anni
7.999
-0.889
-10.0%
1 gen 1973 anni
9.014
+1.015
12.69%
1 gen 1974 anni
6.99
-2.024
-22.46%
1 gen 1975 anni
4.109
-2.881
-41.22%
1 gen 1976 anni
6.399
+2.29
55.73%
1 gen 1977 anni
3.865
-2.533
-39.59%
1 gen 1978 anni
3.456
-0.409
-10.59%
1 gen 1979 anni
3.169
-0.287
-8.31%
1 gen 1980 anni
3.101
-0.068
-2.13%
1 gen 1981 anni
2.058
-1.043
-33.63%
1 gen 1982 anni
2.011
-0.047
-2.29%
1 gen 1983 anni
2.091
+0.08
3.99%
1 gen 1984 anni
2.317
+0.226
10.82%
1 gen 1985 anni
2.361
+0.043
1.86%
1 gen 1986 anni
2.123
-0.237
-10.06%
1 gen 1987 anni
4.209
+2.086
98.24%
1 gen 1988 anni
4.523
+0.314
7.46%
1 gen 1989 anni
5.951
+1.428
31.58%
1 gen 1990 anni
6.552
+0.601
10.1%
1 gen 1991 anni
5.483
-1.069
-16.31%
1 gen 1992 anni
5.895
+0.412
7.51%
1 gen 1993 anni
6.162
+0.267
4.53%
1 gen 1994 anni
7.64
+1.478
23.99%
1 gen 1995 anni
8.015
+0.374
4.9%
1 gen 1996 anni
8.396
+0.381
4.76%
1 gen 1997 anni
8.206
-0.19
-2.26%
1 gen 1998 anni
9.584
+1.378
16.79%
1 gen 1999 anni
11.016
+1.432
14.94%
1 gen 2000 anni
8.305
-2.71
-24.61%
1 gen 2001 anni
5.654
-2.651
-31.92%
1 gen 2002 anni
5.147
-0.508
-8.98%
1 gen 2003 anni
6.494
+1.347
26.17%
1 gen 2004 anni
4.15
-2.344
-36.09%
1 gen 2005 anni
3.554
-0.596
-14.36%
1 gen 2006 anni
3.142
-0.412
-11.6%
1 gen 2007 anni
2.319
-0.823
-26.19%
1 gen 2008 anni
2.568
+0.249
10.73%
1 gen 2009 anni
1.985
-0.583
-22.71%
1 gen 2010 anni
3.239
+1.255
63.23%
1 gen 2011 anni
2.521
-0.718
-22.16%
Classificazione dei paesi secondo i statistiche attuali per anni


Commenti: