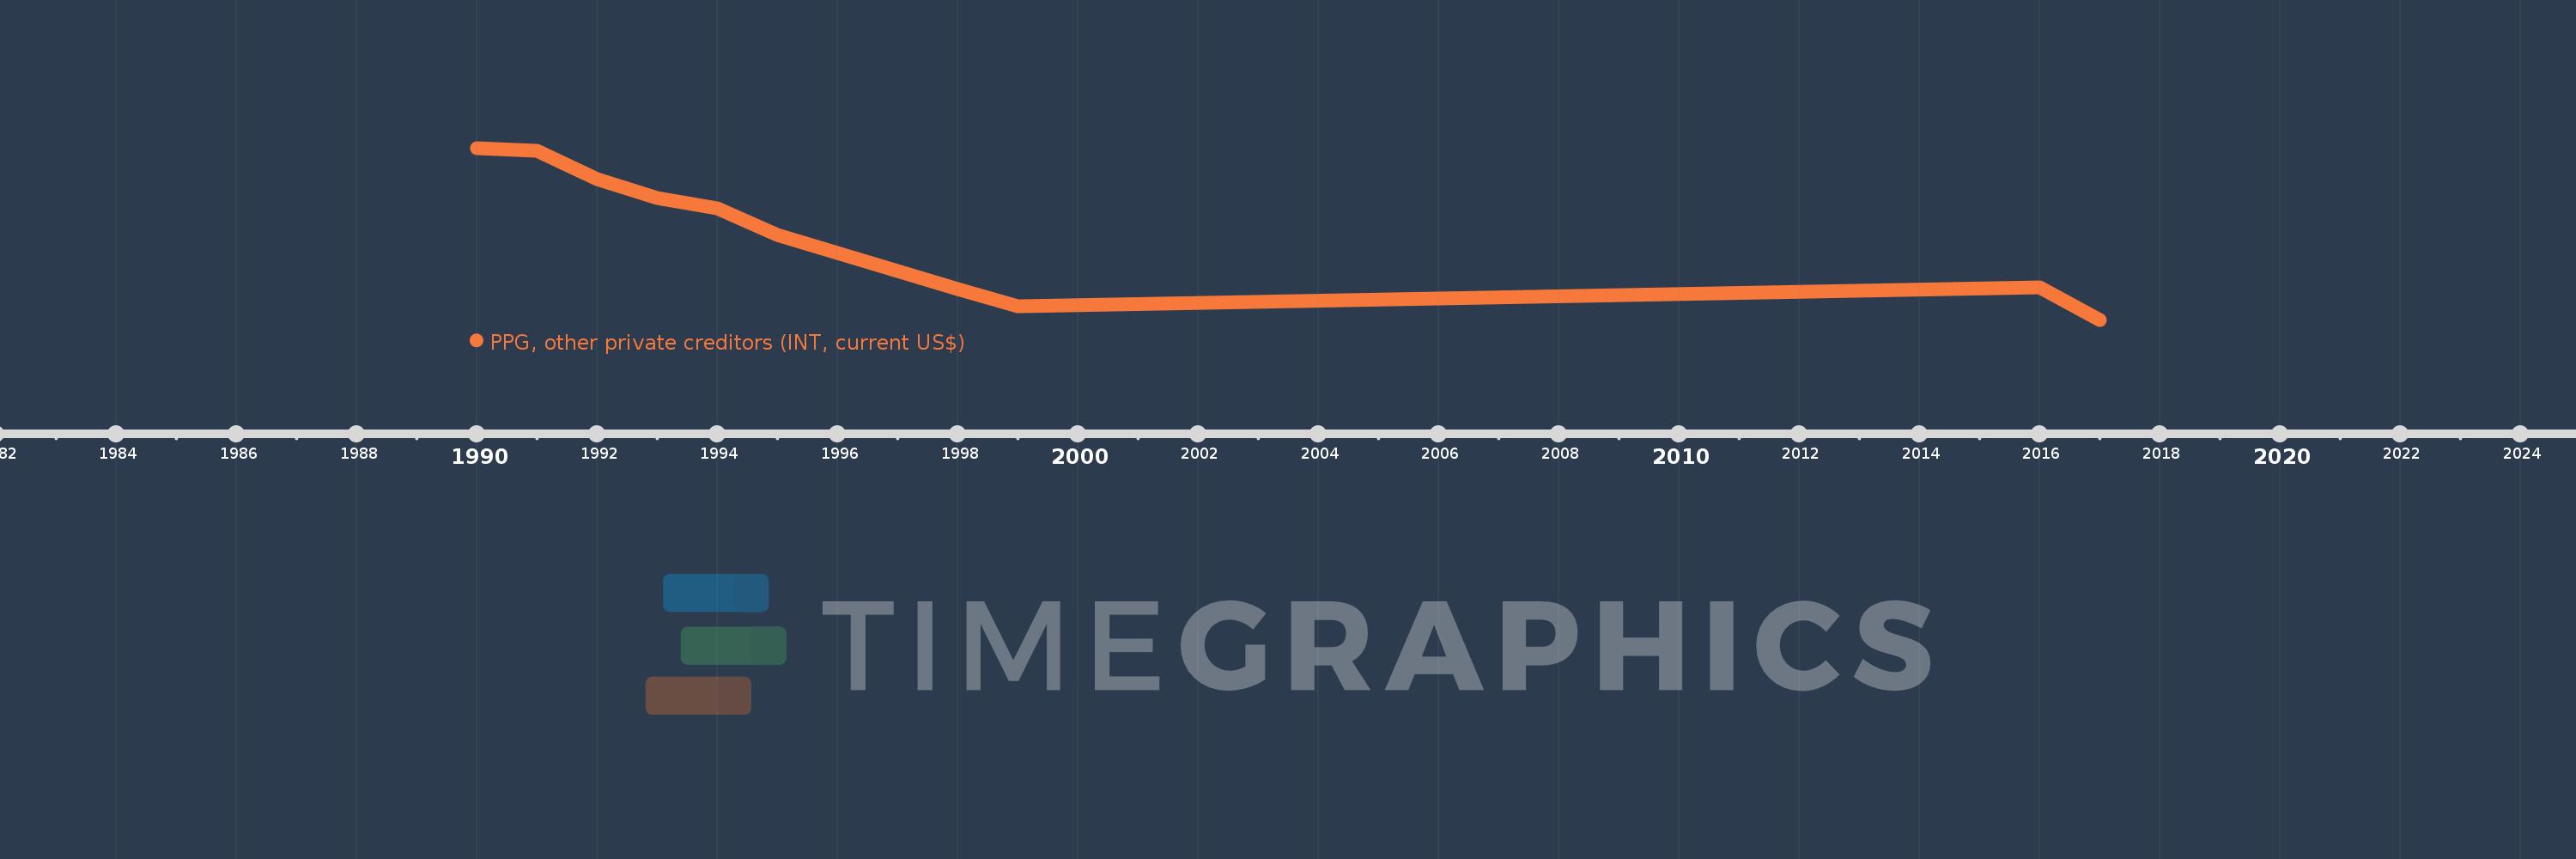
Questa scala temporale mostra un grafico dal 1990 anno al 2017 anno. Bhutan. I dati fino ad 1989 anno non disponibili. Il numero di osservazioni attuali secondo i date: 12.
La fonte (nome):
Indicatori dello sviluppo mondiale
La fonte (organizzazione):
World Bank, International Debt Statistics.
Categorie:
External Debt
sono stati aggiornati
23 apr 2017 anni
Indicatori delle variazioni dei valori per anni
In media:
785.167 Mille.
Minima:
0.0
1 gen 2017 anni
Massimo:
1.634 Mln
1 gen 1990 anni
Alla data di osservazione
Valore
Variazione assoluta
La variazione rispetto al valore precedente
1 gen 1990 anni
1.634 Mln
+1.634 Mln
0.0%
1 gen 1991 anni
1.61 Mln
-24.0 Mille.
-1.47%
1 gen 1992 anni
1.337 Mln
-273.0 Mille.
-16.96%
1 gen 1993 anni
1.157 Mln
-180.0 Mille.
-13.46%
1 gen 1994 anni
1.061 Mln
-96.0 Mille.
-8.3%
1 gen 1995 anni
803.0 Mille.
-258.0 Mille.
-24.32%
1 gen 1996 anni
635.0 Mille.
-168.0 Mille.
-20.92%
1 gen 1997 anni
460.0 Mille.
-175.0 Mille.
-27.56%
1 gen 1998 anni
292.0 Mille.
-168.0 Mille.
-36.52%
1 gen 1999 anni
126.0 Mille.
-166.0 Mille.
-56.85%
1 gen 2016 anni
307.0 Mille.
+181.0 Mille.
143.65%
1 gen 2017 anni
0.0
-307.0 Mille.
-100.0%
Classificazione dei paesi secondo i statistiche attuali per anni
