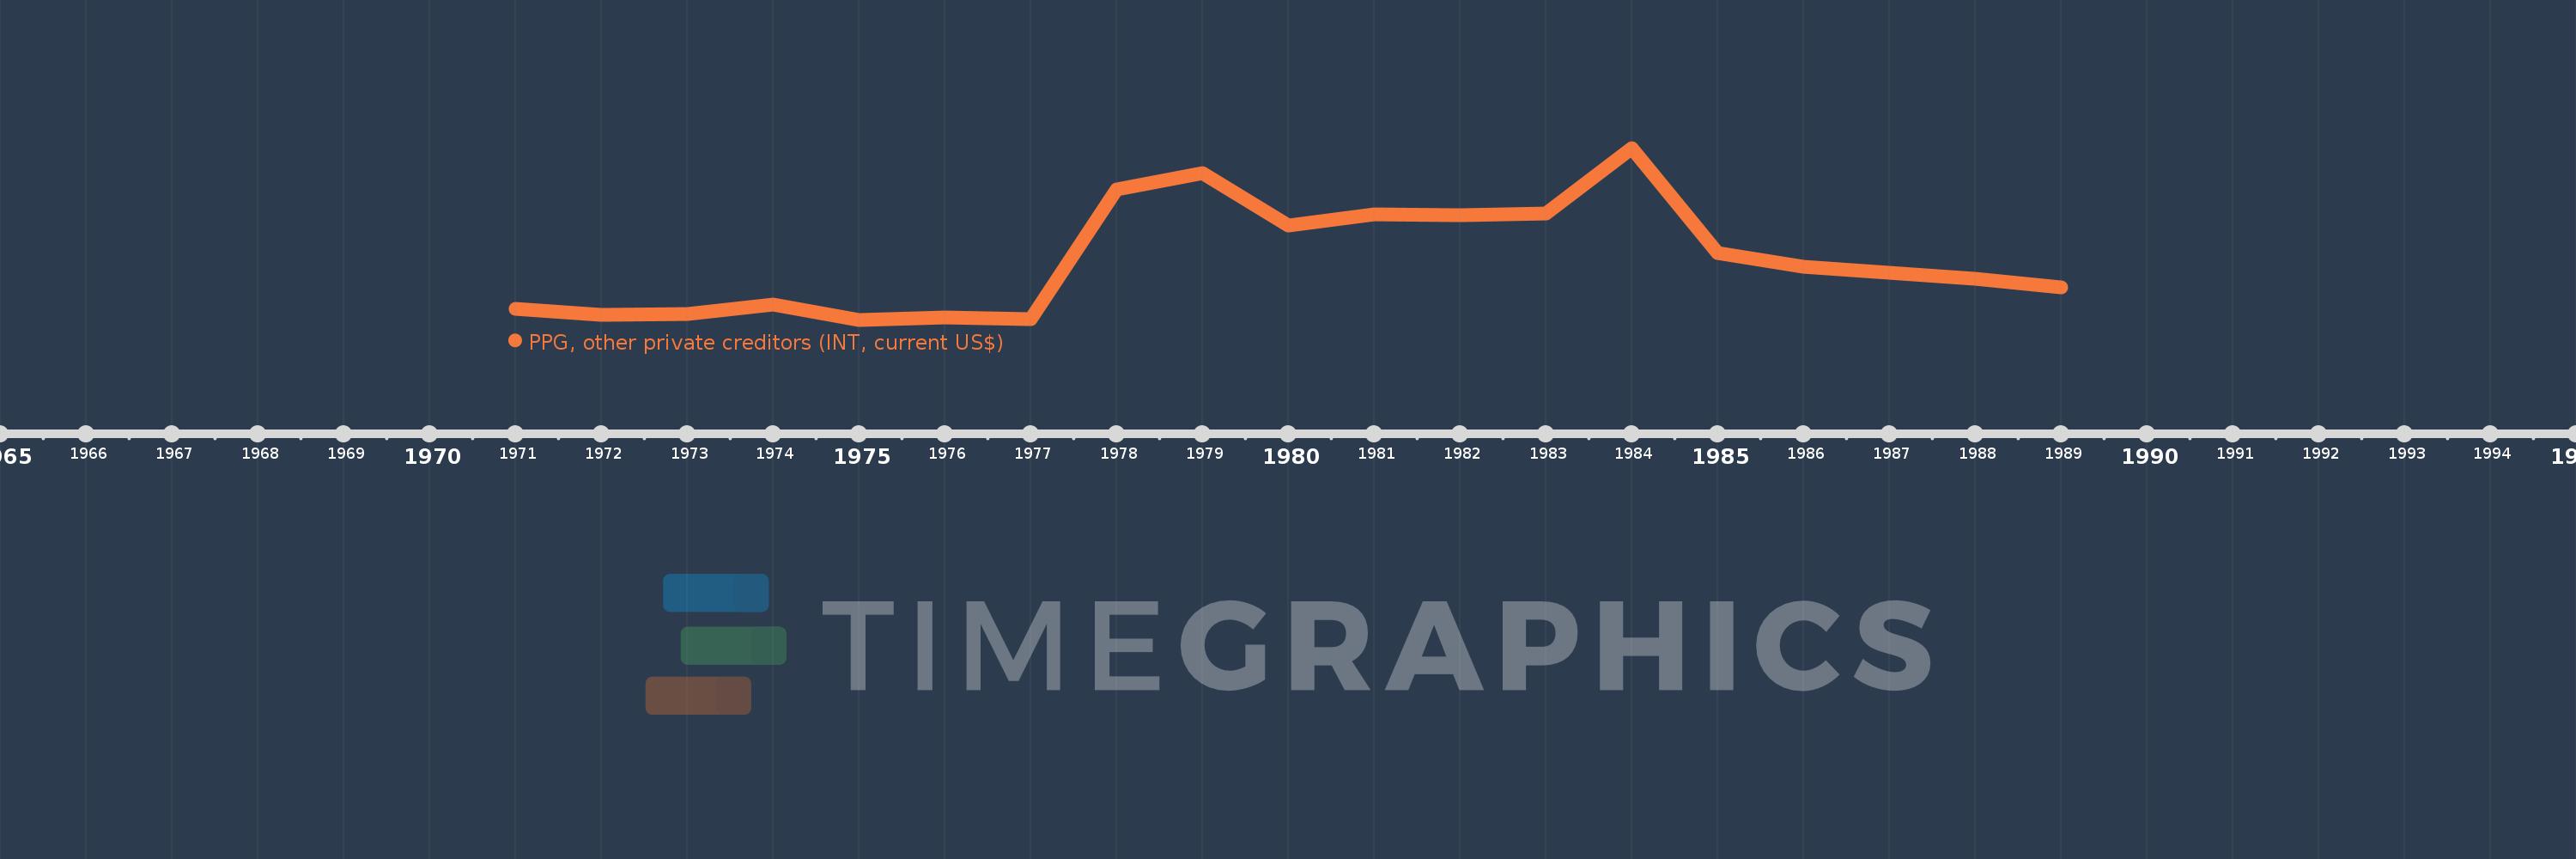
Questa scala temporale mostra un grafico dal 1971 anno al 1989 anno. Haiti. I dati fino ad 1970 anno non disponibili. Il numero di osservazioni attuali secondo i date: 19.
La fonte (nome):
Indicatori dello sviluppo mondiale
La fonte (organizzazione):
World Bank, International Debt Statistics.
Categorie:
External Debt
sono stati aggiornati
23 apr 2017 anni
Indicatori delle variazioni dei valori per anni
In media:
617.316 Mille.
Minima:
144.0 Mille.
1 gen 1975 anni
Massimo:
1.5 Mln
1 gen 1984 anni
Alla data di osservazione
Valore
Variazione assoluta
La variazione rispetto al valore precedente
1 gen 1971 anni
230.0 Mille.
+230.0 Mille.
0.0%
1 gen 1972 anni
180.0 Mille.
-50.0 Mille.
-21.74%
1 gen 1973 anni
188.0 Mille.
+8.0 Mille.
4.44%
1 gen 1974 anni
267.0 Mille.
+79.0 Mille.
42.02%
1 gen 1975 anni
144.0 Mille.
-123.0 Mille.
-46.07%
1 gen 1976 anni
162.0 Mille.
+18.0 Mille.
12.5%
1 gen 1977 anni
152.0 Mille.
-10.0 Mille.
-6.17%
1 gen 1978 anni
1.172 Mln
+1.02 Mln
671.05%
1 gen 1979 anni
1.3 Mln
+128.0 Mille.
10.92%
1 gen 1980 anni
888.0 Mille.
-412.0 Mille.
-31.69%
1 gen 1981 anni
976.0 Mille.
+88.0 Mille.
9.91%
1 gen 1982 anni
967.0 Mille.
-9.0 Mille.
-0.92%
1 gen 1983 anni
986.0 Mille.
+19.0 Mille.
1.96%
1 gen 1984 anni
1.5 Mln
+514.0 Mille.
52.13%
1 gen 1985 anni
672.0 Mille.
-828.0 Mille.
-55.2%
1 gen 1986 anni
562.0 Mille.
-110.0 Mille.
-16.37%
1 gen 1987 anni
516.0 Mille.
-46.0 Mille.
-8.19%
1 gen 1988 anni
470.0 Mille.
-46.0 Mille.
-8.91%
1 gen 1989 anni
397.0 Mille.
-73.0 Mille.
-15.53%
Classificazione dei paesi secondo i statistiche attuali per anni
