29
/it/
it
AIzaSyAYiBZKx7MnpbEhh9jyipgxe19OcubqV5w
April 1, 2024
80059
Barbados
BRB
true
2
1
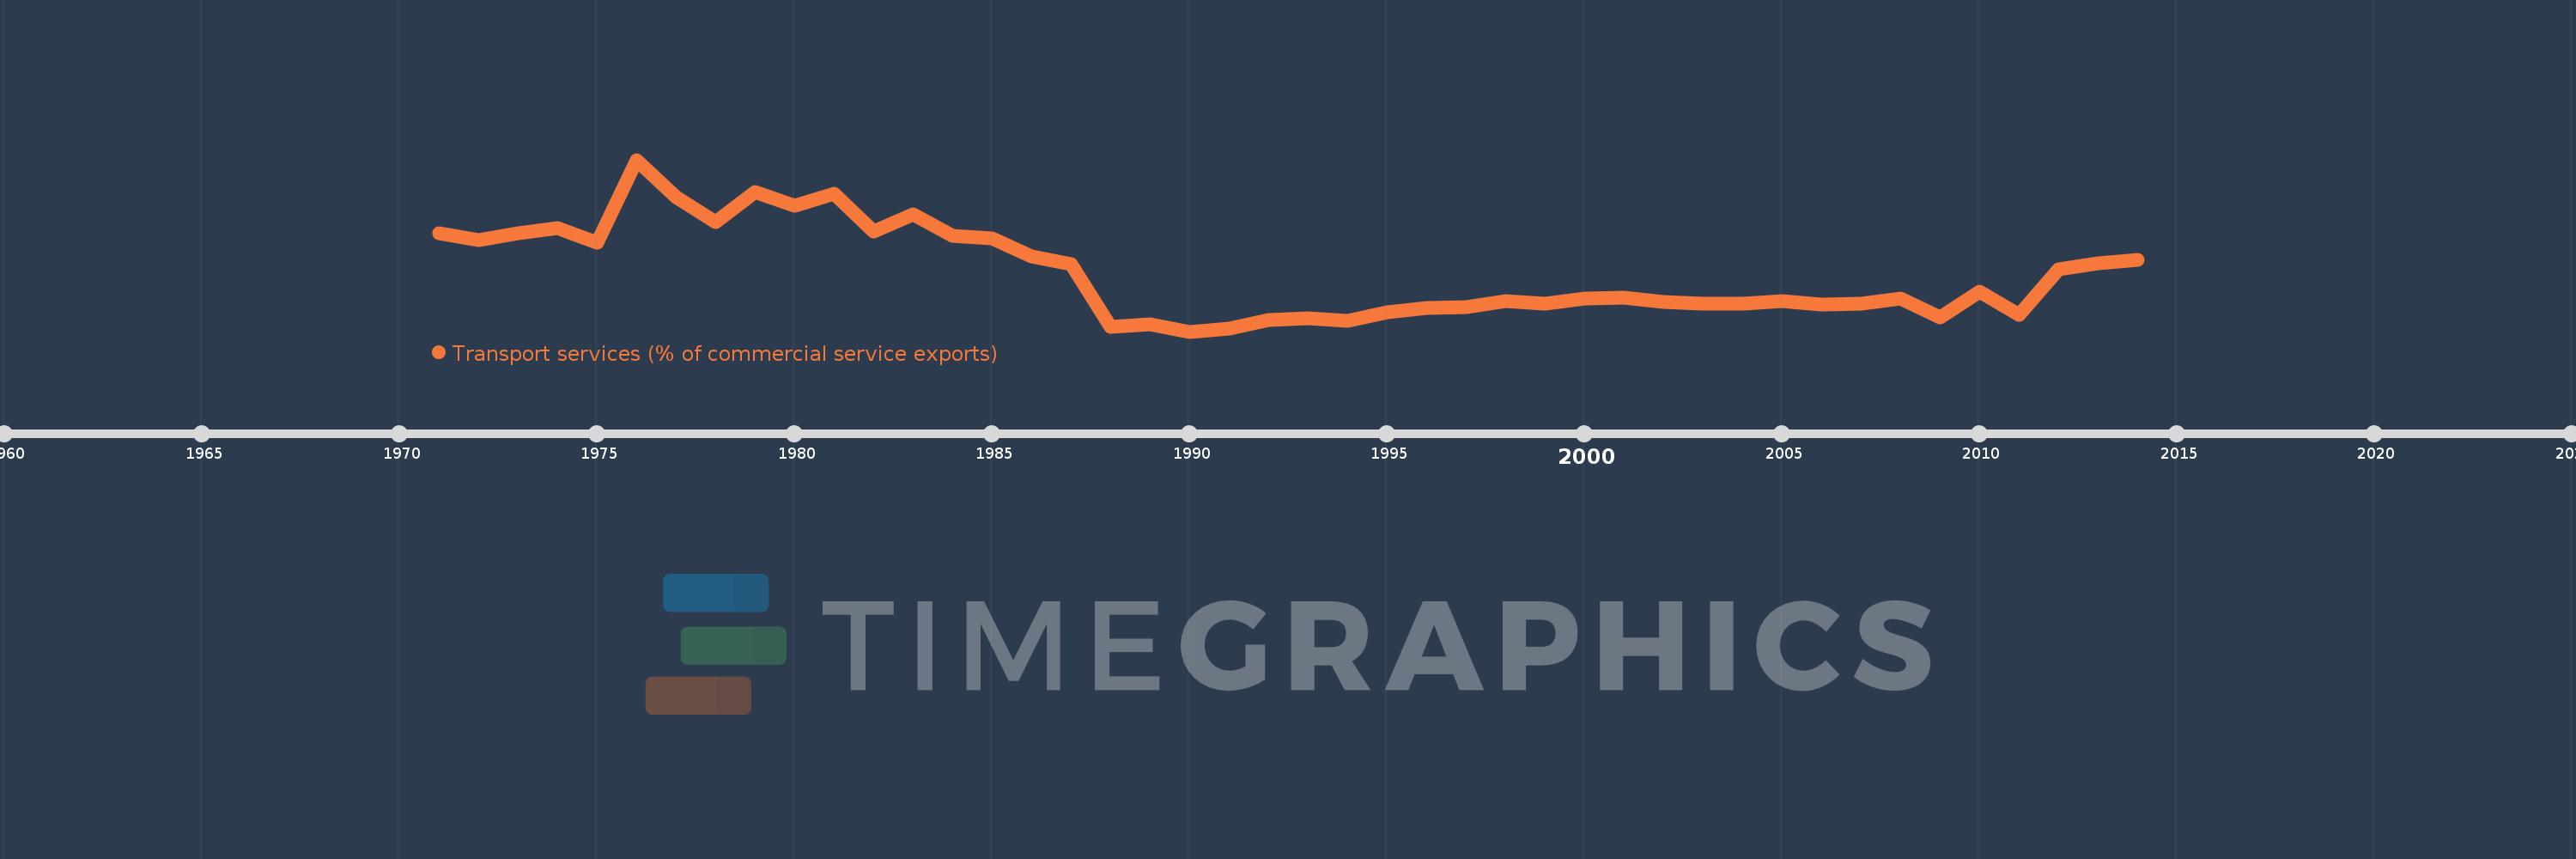
Transport services (% of commercial service exports)
2014,2013,2012,2011,2010,2009,2008,2007,2006,2005,2004,2003,2002,2001,2000,1999,1998,1997,1996,1995,1994,1993,1992,1991,1990,1989,1988,1987,1986,1985,1984,1983,1982,1981,1980,1979,1978,1977,1976,1975,1974,1973,1972,1971
Queste statistiche in altri paesi:
AfghanistanAlbaniaAlgeriaAngolaAntigua and BarbudaArab WorldArgentinaArmeniaArubaAustraliaAustriaAzerbaijanBahamas, TheBahrainBangladeshBarbadosBelarusBelgiumBelizeBeninBermudaBhutanBoliviaBosnia and HerzegovinaBotswanaBrazilBrunei DarussalamBulgariaBurkina FasoBurundiCabo VerdeCambodiaCameroonCanadaCaribbean small statesCentral African RepublicCentral Europe and the BalticsChadChileChinaColombiaComorosCongo, Dem. Rep.Congo, Rep.Costa RicaCote d'IvoireCroatiaCuracaoCyprusCzech RepublicDenmarkDjiboutiDominicaDominican RepublicEarly-demographic dividendEast Asia & PacificEast Asia & Pacific (excluding high income)East Asia & Pacific (IDA & IBRD countries)EcuadorEgypt, Arab Rep.El SalvadorEritreaEstoniaEthiopiaEuro areaEurope & Central AsiaEurope & Central Asia (excluding high income)Europe & Central Asia (IDA & IBRD countries)European UnionFaroe IslandsFijiFinlandFragile and conflict affected situationsFranceFrench PolynesiaGabonGambia, TheGeorgiaGermanyGhanaGreeceGrenadaGuatemalaGuineaGuinea-BissauGuyanaHaitiHeavily indebted poor countries (HIPC)High incomeHondurasHong Kong SAR, ChinaHungaryIBRD onlyIcelandIDA & IBRD totalIDA onlyIDA totalIndiaIndonesiaIran, Islamic Rep.IraqIrelandIsraelItalyJamaicaJapanJordanKazakhstanKenyaKiribatiKorea, Rep.KosovoKuwaitKyrgyz RepublicLao PDRLate-demographic dividendLatin America & Caribbean Latin America & Caribbean (excluding high income)Latin America & the Caribbean (IDA & IBRD countries)LatviaLeast developed countries: UN classificationLebanonLesothoLiberiaLibyaLithuaniaLow & middle incomeLow incomeLower middle incomeLuxembourgMacao SAR, ChinaMacedonia, FYRMadagascarMalawiMalaysiaMaldivesMaliMaltaMarshall IslandsMauritaniaMauritiusMexicoMicronesia, Fed. Sts.Middle East & North AfricaMiddle East & North Africa (excluding high income)Middle East & North Africa (IDA & IBRD countries)Middle incomeMoldovaMongoliaMontenegroMoroccoMozambiqueMyanmarNamibiaNepalNetherlandsNew CaledoniaNew ZealandNicaraguaNigerNigeriaNorth AmericaNorwayOECD membersOmanOther small statesPacific island small statesPakistanPalauPanamaPapua New GuineaParaguayPeruPhilippinesPolandPortugalPost-demographic dividendPre-demographic dividendQatarRomaniaRussian FederationRwandaSamoaSao Tome and PrincipeSaudi ArabiaSenegalSerbiaSeychellesSierra LeoneSingaporeSint Maarten (Dutch part)Slovak RepublicSloveniaSmall statesSolomon IslandsSouth AfricaSouth AsiaSouth Asia (IDA & IBRD)South SudanSpainSri LankaSt. Kitts and NevisSt. LuciaSt. Vincent and the GrenadinesSub-Saharan Africa Sub-Saharan Africa (excluding high income)Sub-Saharan Africa (IDA & IBRD countries)SudanSurinameSwazilandSwedenSwitzerlandSyrian Arab RepublicTajikistanTanzaniaThailandTimor-LesteTogoTongaTrinidad and TobagoTunisiaTurkeyTuvaluUgandaUkraineUnited KingdomUnited StatesUpper middle incomeUruguayVanuatuVenezuela, RBWest Bank and GazaWorldYemen, Rep.ZambiaZimbabwe Linea del tempo:
Questa scala temporale mostra un grafico dal 1971 anno al 2014 anno. Barbados. I dati fino ad 1970 anno non disponibili. Il numero di osservazioni attuali secondo i date: 44.
La fonte (nome):
Indicatori dello sviluppo mondiale
La fonte (organizzazione):
International Monetary Fund, Balance of Payments Statistics Yearbook and data files.
Categorie:
Private Sector, Trade
sono stati aggiornati
23 apr 2017 anni
Indicatori delle variazioni dei valori per anni
Minima:
0.911
1 gen 1990 anni
Massimo:
8.847
1 gen 1976 anni
Alla data di osservazione
Valore
Variazione assoluta
La variazione rispetto al valore precedente
1 gen 1971 anni
5.458
+5.458
0.0%
1 gen 1972 anni
5.15
-0.308
-5.64%
1 gen 1973 anni
5.437
+0.287
5.57%
1 gen 1974 anni
5.687
+0.25
4.6%
1 gen 1975 anni
5.014
-0.674
-11.85%
1 gen 1976 anni
8.847
+3.833
76.45%
1 gen 1977 anni
7.113
-1.734
-19.6%
1 gen 1978 anni
5.978
-1.135
-15.96%
1 gen 1979 anni
7.375
+1.397
23.37%
1 gen 1980 anni
6.709
-0.665
-9.02%
1 gen 1981 anni
7.284
+0.575
8.56%
1 gen 1982 anni
5.521
-1.763
-24.21%
1 gen 1983 anni
6.329
+0.808
14.64%
1 gen 1984 anni
5.343
-0.986
-15.57%
1 gen 1985 anni
5.197
-0.146
-2.74%
1 gen 1986 anni
4.39
-0.807
-15.54%
1 gen 1987 anni
4.01
-0.379
-8.64%
1 gen 1988 anni
1.125
-2.885
-71.95%
1 gen 1989 anni
1.236
+0.111
9.86%
1 gen 1990 anni
0.911
-0.325
-26.28%
1 gen 1991 anni
1.044
+0.133
14.64%
1 gen 1992 anni
1.456
+0.412
39.43%
1 gen 1993 anni
1.534
+0.077
5.31%
1 gen 1994 anni
1.417
-0.116
-7.58%
1 gen 1995 anni
1.807
+0.389
27.47%
1 gen 1996 anni
2.022
+0.215
11.91%
1 gen 1997 anni
2.027
+0.005
0.24%
1 gen 1998 anni
2.307
+0.28
13.82%
1 gen 1999 anni
2.22
-0.087
-3.76%
1 gen 2000 anni
2.436
+0.216
9.72%
1 gen 2001 anni
2.478
+0.042
1.73%
1 gen 2002 anni
2.287
-0.191
-7.7%
1 gen 2003 anni
2.208
-0.079
-3.45%
1 gen 2004 anni
2.181
-0.027
-1.22%
1 gen 2005 anni
2.335
+0.154
7.05%
1 gen 2006 anni
2.17
-0.165
-7.07%
1 gen 2007 anni
2.185
+0.015
0.7%
1 gen 2008 anni
2.421
+0.235
10.77%
1 gen 2009 anni
1.576
-0.844
-34.87%
1 gen 2010 anni
2.756
+1.179
74.8%
1 gen 2011 anni
1.675
-1.08
-39.2%
1 gen 2012 anni
3.783
+2.107
125.77%
1 gen 2013 anni
4.054
+0.272
7.19%
1 gen 2014 anni
4.213
+0.158
3.9%
Classificazione dei paesi secondo i statistiche attuali per anni


Commenti: