29
/it/
it
AIzaSyAYiBZKx7MnpbEhh9jyipgxe19OcubqV5w
April 1, 2024
281783
Venezuela, RB
VEN
true
2
1
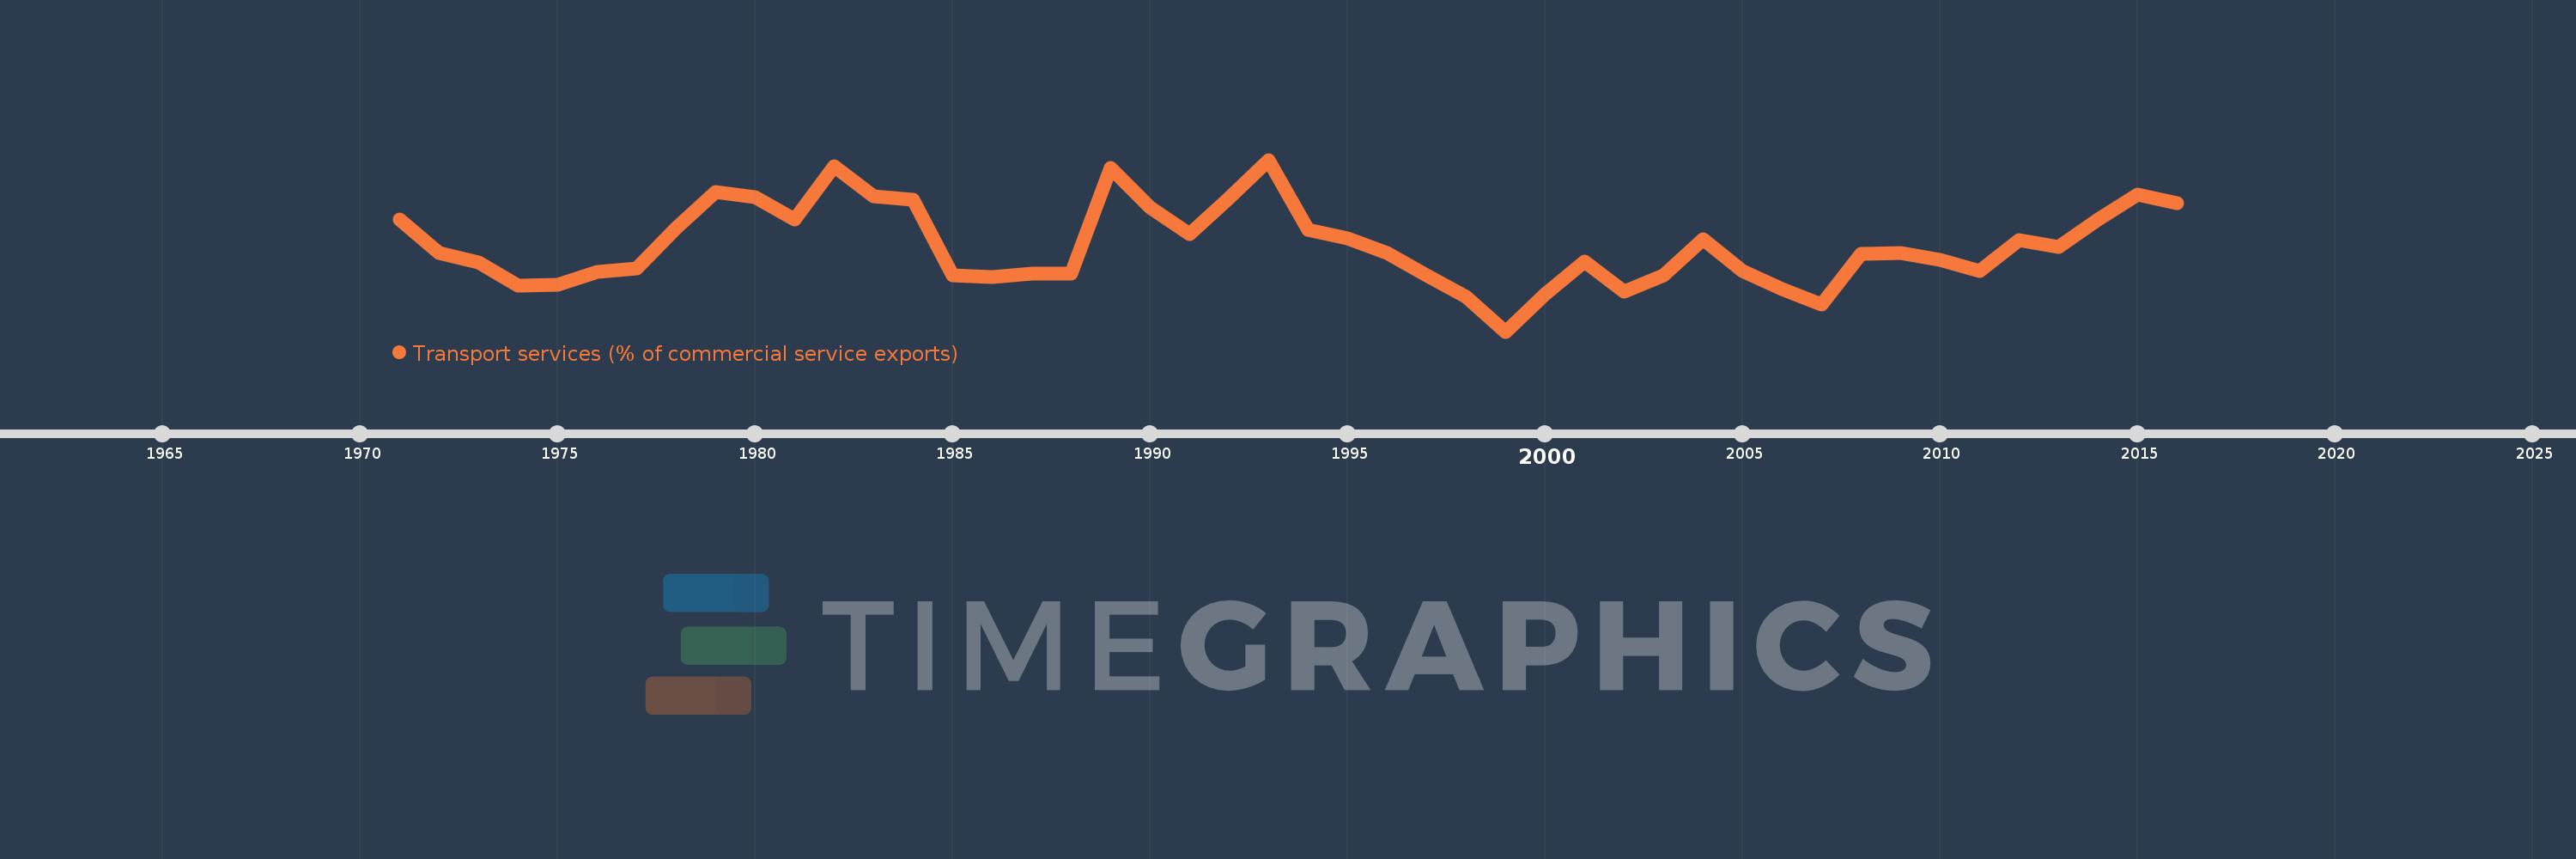
Transport services (% of commercial service exports)
2016,2015,2014,2013,2012,2011,2010,2009,2008,2007,2006,2005,2004,2003,2002,2001,2000,1999,1998,1997,1996,1995,1994,1993,1992,1991,1990,1989,1988,1987,1986,1985,1984,1983,1982,1981,1980,1979,1978,1977,1976,1975,1974,1973,1972,1971
Queste statistiche in altri paesi:
AfghanistanAlbaniaAlgeriaAngolaAntigua and BarbudaArab WorldArgentinaArmeniaArubaAustraliaAustriaAzerbaijanBahamas, TheBahrainBangladeshBarbadosBelarusBelgiumBelizeBeninBermudaBhutanBoliviaBosnia and HerzegovinaBotswanaBrazilBrunei DarussalamBulgariaBurkina FasoBurundiCabo VerdeCambodiaCameroonCanadaCaribbean small statesCentral African RepublicCentral Europe and the BalticsChadChileChinaColombiaComorosCongo, Dem. Rep.Congo, Rep.Costa RicaCote d'IvoireCroatiaCuracaoCyprusCzech RepublicDenmarkDjiboutiDominicaDominican RepublicEarly-demographic dividendEast Asia & PacificEast Asia & Pacific (excluding high income)East Asia & Pacific (IDA & IBRD countries)EcuadorEgypt, Arab Rep.El SalvadorEritreaEstoniaEthiopiaEuro areaEurope & Central AsiaEurope & Central Asia (excluding high income)Europe & Central Asia (IDA & IBRD countries)European UnionFaroe IslandsFijiFinlandFragile and conflict affected situationsFranceFrench PolynesiaGabonGambia, TheGeorgiaGermanyGhanaGreeceGrenadaGuatemalaGuineaGuinea-BissauGuyanaHaitiHeavily indebted poor countries (HIPC)High incomeHondurasHong Kong SAR, ChinaHungaryIBRD onlyIcelandIDA & IBRD totalIDA onlyIDA totalIndiaIndonesiaIran, Islamic Rep.IraqIrelandIsraelItalyJamaicaJapanJordanKazakhstanKenyaKiribatiKorea, Rep.KosovoKuwaitKyrgyz RepublicLao PDRLate-demographic dividendLatin America & Caribbean Latin America & Caribbean (excluding high income)Latin America & the Caribbean (IDA & IBRD countries)LatviaLeast developed countries: UN classificationLebanonLesothoLiberiaLibyaLithuaniaLow & middle incomeLow incomeLower middle incomeLuxembourgMacao SAR, ChinaMacedonia, FYRMadagascarMalawiMalaysiaMaldivesMaliMaltaMarshall IslandsMauritaniaMauritiusMexicoMicronesia, Fed. Sts.Middle East & North AfricaMiddle East & North Africa (excluding high income)Middle East & North Africa (IDA & IBRD countries)Middle incomeMoldovaMongoliaMontenegroMoroccoMozambiqueMyanmarNamibiaNepalNetherlandsNew CaledoniaNew ZealandNicaraguaNigerNigeriaNorth AmericaNorwayOECD membersOmanOther small statesPacific island small statesPakistanPalauPanamaPapua New GuineaParaguayPeruPhilippinesPolandPortugalPost-demographic dividendPre-demographic dividendQatarRomaniaRussian FederationRwandaSamoaSao Tome and PrincipeSaudi ArabiaSenegalSerbiaSeychellesSierra LeoneSingaporeSint Maarten (Dutch part)Slovak RepublicSloveniaSmall statesSolomon IslandsSouth AfricaSouth AsiaSouth Asia (IDA & IBRD)South SudanSpainSri LankaSt. Kitts and NevisSt. LuciaSt. Vincent and the GrenadinesSub-Saharan Africa Sub-Saharan Africa (excluding high income)Sub-Saharan Africa (IDA & IBRD countries)SudanSurinameSwazilandSwedenSwitzerlandSyrian Arab RepublicTajikistanTanzaniaThailandTimor-LesteTogoTongaTrinidad and TobagoTunisiaTurkeyTuvaluUgandaUkraineUnited KingdomUnited StatesUpper middle incomeUruguayVanuatuVenezuela, RBWest Bank and GazaWorldYemen, Rep.ZambiaZimbabwe Linea del tempo:
Questa scala temporale mostra un grafico dal 1971 anno al 2016 anno. Venezuela, RB. I dati fino ad 1970 anno non disponibili. Il numero di osservazioni attuali secondo i date: 46.
La fonte (nome):
Indicatori dello sviluppo mondiale
La fonte (organizzazione):
International Monetary Fund, Balance of Payments Statistics Yearbook and data files.
Categorie:
Private Sector, Trade
sono stati aggiornati
23 apr 2017 anni
Indicatori delle variazioni dei valori per anni
Minima:
26.047
1 gen 1999 anni
Massimo:
51.925
1 gen 1993 anni
Alla data di osservazione
Valore
Variazione assoluta
La variazione rispetto al valore precedente
1 gen 1971 anni
42.879
+42.879
0.0%
1 gen 1972 anni
37.929
-4.95
-11.54%
1 gen 1973 anni
36.51
-1.419
-3.74%
1 gen 1974 anni
32.961
-3.549
-9.72%
1 gen 1975 anni
33.084
+0.123
0.37%
1 gen 1976 anni
35.085
+2.0
6.05%
1 gen 1977 anni
35.617
+0.533
1.52%
1 gen 1978 anni
41.588
+5.97
16.76%
1 gen 1979 anni
47.044
+5.457
13.12%
1 gen 1980 anni
46.265
-0.779
-1.66%
1 gen 1981 anni
42.911
-3.354
-7.25%
1 gen 1982 anni
51.001
+8.09
18.85%
1 gen 1983 anni
46.474
-4.527
-8.88%
1 gen 1984 anni
45.903
-0.571
-1.23%
1 gen 1985 anni
34.468
-11.435
-24.91%
1 gen 1986 anni
34.276
-0.192
-0.56%
1 gen 1987 anni
34.736
+0.459
1.34%
1 gen 1988 anni
34.756
+0.02
0.06%
1 gen 1989 anni
50.736
+15.981
45.98%
1 gen 1990 anni
44.728
-6.008
-11.84%
1 gen 1991 anni
40.747
-3.981
-8.9%
1 gen 1992 anni
46.181
+5.433
13.33%
1 gen 1993 anni
51.925
+5.744
12.44%
1 gen 1994 anni
41.399
-10.526
-20.27%
1 gen 1995 anni
40.15
-1.249
-3.02%
1 gen 1996 anni
37.848
-2.302
-5.73%
1 gen 1997 anni
34.586
-3.262
-8.62%
1 gen 1998 anni
31.35
-3.237
-9.36%
1 gen 1999 anni
26.047
-5.303
-16.92%
1 gen 2000 anni
31.709
+5.663
21.74%
1 gen 2001 anni
36.569
+4.86
15.33%
1 gen 2002 anni
32.103
-4.467
-12.21%
1 gen 2003 anni
34.46
+2.357
7.34%
1 gen 2004 anni
40.0
+5.54
16.08%
1 gen 2005 anni
35.117
-4.883
-12.21%
1 gen 2006 anni
32.428
-2.689
-7.66%
1 gen 2007 anni
30.173
-2.255
-6.95%
1 gen 2008 anni
37.757
+7.584
25.14%
1 gen 2009 anni
37.919
+0.162
0.43%
1 gen 2010 anni
36.831
-1.088
-2.87%
1 gen 2011 anni
35.127
-1.704
-4.63%
1 gen 2012 anni
39.79
+4.663
13.28%
1 gen 2013 anni
38.76
-1.031
-2.59%
1 gen 2014 anni
42.942
+4.182
10.79%
1 gen 2015 anni
46.735
+3.793
8.83%
1 gen 2016 anni
45.406
-1.329
-2.84%
Classificazione dei paesi secondo i statistiche attuali per anni


Commenti: