29
/it/
it
AIzaSyAYiBZKx7MnpbEhh9jyipgxe19OcubqV5w
April 1, 2024
79693
Barbados
BRB
true
2
1
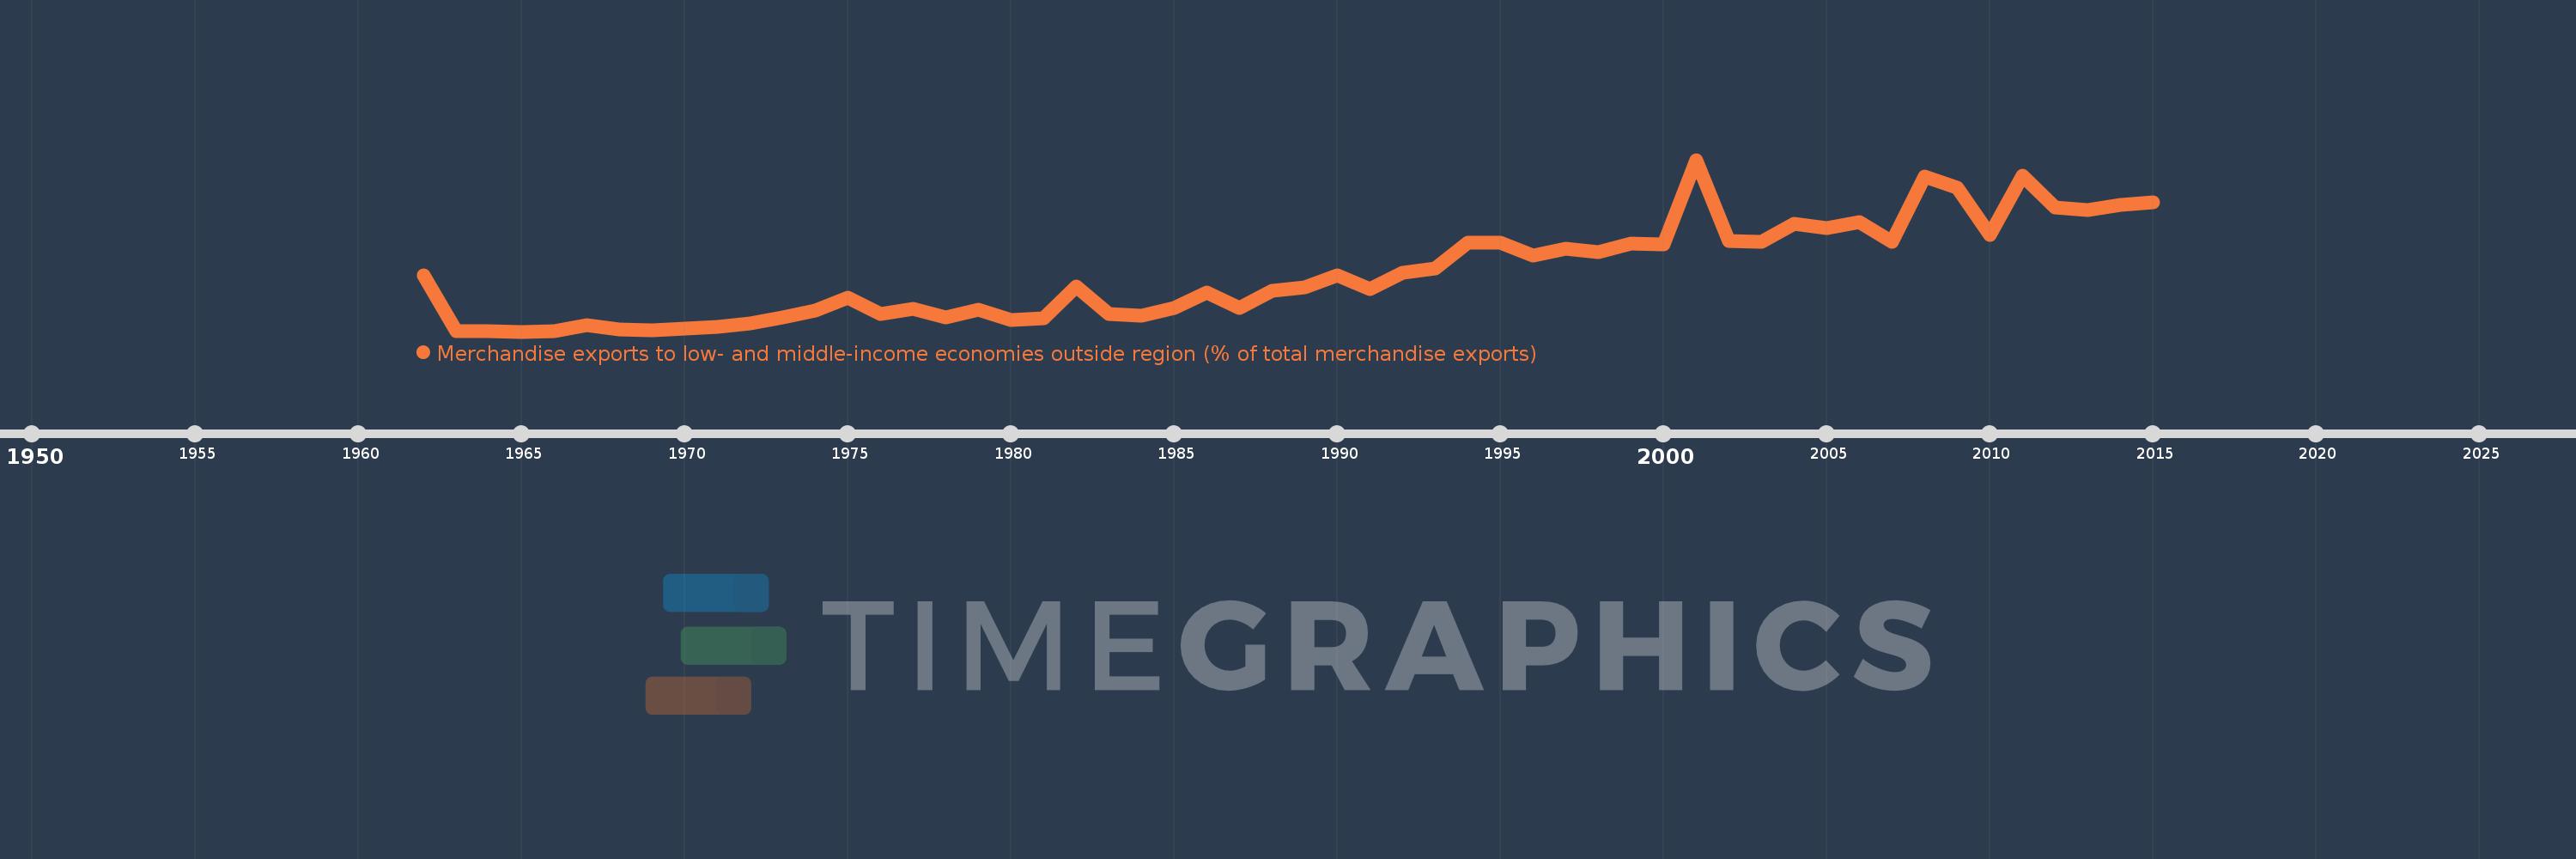
Merchandise exports to low- and middle-income economies outside region (% of total merchandise exports)
2015,2014,2013,2012,2011,2010,2009,2008,2007,2006,2005,2004,2003,2002,2001,2000,1999,1998,1997,1996,1995,1994,1993,1992,1991,1990,1989,1988,1987,1986,1985,1984,1983,1982,1981,1980,1979,1978,1977,1976,1975,1974,1973,1972,1971,1969,1968,1967,1966,1965,1964,1963,1962
Queste statistiche in altri paesi:
AfghanistanAlbaniaAlgeriaAngolaArab WorldArgentinaArmeniaArubaAustraliaAustriaAzerbaijanBahamas, TheBahrainBangladeshBarbadosBelarusBelgiumBelizeBeninBermudaBoliviaBrazilBrunei DarussalamBulgariaBurundiCabo VerdeCambodiaCameroonCanadaCaribbean small statesCentral African RepublicCentral Europe and the BalticsChileChinaColombiaCongo, Dem. Rep.Congo, Rep.Costa RicaCote d'IvoireCroatiaCubaCyprusCzech RepublicDenmarkDominicaDominican RepublicEarly-demographic dividendEast Asia & PacificEast Asia & Pacific (excluding high income)East Asia & Pacific (IDA & IBRD countries)EcuadorEgypt, Arab Rep.El SalvadorEstoniaEthiopiaEuro areaEurope & Central AsiaEurope & Central Asia (excluding high income)Europe & Central Asia (IDA & IBRD countries)European UnionFijiFinlandFragile and conflict affected situationsFranceGabonGambia, TheGeorgiaGermanyGhanaGreeceGreenlandGuatemalaGuineaGuyanaHaitiHeavily indebted poor countries (HIPC)High incomeHondurasHong Kong SAR, ChinaHungaryIBRD onlyIcelandIDA & IBRD totalIDA blendIDA onlyIDA totalIndiaIndonesiaIran, Islamic Rep.IraqIrelandIsraelItalyJamaicaJapanJordanKazakhstanKenyaKorea, Dem. People’s Rep.Korea, Rep.KuwaitLao PDRLate-demographic dividendLatin America & Caribbean Latin America & Caribbean (excluding high income)Latin America & the Caribbean (IDA & IBRD countries)LatviaLeast developed countries: UN classificationLebanonLiberiaLibyaLithuaniaLow & middle incomeLow incomeLower middle incomeLuxembourgMacao SAR, ChinaMacedonia, FYRMadagascarMalawiMalaysiaMaliMaltaMauritaniaMauritiusMexicoMiddle East & North AfricaMiddle East & North Africa (excluding high income)Middle East & North Africa (IDA & IBRD countries)Middle incomeMoldovaMongoliaMontenegroMoroccoMozambiqueMyanmarNetherlandsNew CaledoniaNew ZealandNicaraguaNigerNigeriaNorth AmericaNorwayOECD membersOmanOther small statesPacific island small statesPakistanPanamaPapua New GuineaParaguayPeruPhilippinesPolandPortugalPost-demographic dividendPre-demographic dividendQatarRomaniaRussian FederationRwandaSamoaSaudi ArabiaSenegalSerbiaSeychellesSierra LeoneSingaporeSlovak RepublicSloveniaSmall statesSomaliaSouth AfricaSouth AsiaSouth Asia (IDA & IBRD)SpainSri LankaSt. LuciaSt. Vincent and the GrenadinesSub-Saharan Africa Sub-Saharan Africa (excluding high income)Sub-Saharan Africa (IDA & IBRD countries)SudanSurinameSwedenSwitzerlandSyrian Arab RepublicTanzaniaThailandTogoTrinidad and TobagoTunisiaTurkeyUgandaUkraineUnited Arab EmiratesUnited KingdomUnited StatesUpper middle incomeUruguayVenezuela, RBVietnamWorldYemen, Rep.ZambiaZimbabwe Linea del tempo:
Questa scala temporale mostra un grafico dal 1962 anno al 2015 anno. Barbados. I dati fino ad 1961 anno non disponibili. Il numero di osservazioni attuali secondo i date: 53.
La fonte (nome):
Indicatori dello sviluppo mondiale
La fonte (organizzazione):
World Bank staff estimates based data from International Monetary Fund's Direction of Trade database.
Categorie:
Private Sector, Trade
sono stati aggiornati
23 apr 2017 anni
Indicatori delle variazioni dei valori per anni
Minima:
1.136
1 gen 1965 anni
Massimo:
52.626
1 gen 2001 anni
Alla data di osservazione
Valore
Variazione assoluta
La variazione rispetto al valore precedente
1 gen 1962 anni
18.0
+18.0
0.0%
1 gen 1963 anni
1.149
-16.851
-93.61%
1 gen 1964 anni
1.225
+0.076
6.62%
1 gen 1965 anni
1.136
-0.089
-7.27%
1 gen 1966 anni
1.333
+0.197
17.33%
1 gen 1967 anni
3.03
+1.697
127.27%
1 gen 1968 anni
1.732
-1.298
-42.83%
1 gen 1969 anni
1.639
-0.093
-5.37%
1 gen 1971 anni
2.456
+0.817
49.84%
1 gen 1972 anni
3.599
+1.143
46.52%
1 gen 1973 anni
5.289
+1.69
46.96%
1 gen 1974 anni
7.456
+2.167
40.96%
1 gen 1975 anni
11.429
+3.973
53.29%
1 gen 1976 anni
6.319
-5.11
-44.71%
1 gen 1977 anni
7.991
+1.672
26.46%
1 gen 1978 anni
5.314
-2.677
-33.5%
1 gen 1979 anni
7.752
+2.437
45.87%
1 gen 1980 anni
4.525
-3.227
-41.63%
1 gen 1981 anni
5.161
+0.636
14.06%
1 gen 1982 anni
14.669
+9.508
184.22%
1 gen 1983 anni
6.51
-8.159
-55.62%
1 gen 1984 anni
5.983
-0.527
-8.09%
1 gen 1985 anni
8.189
+2.206
36.87%
1 gen 1986 anni
12.951
+4.762
58.15%
1 gen 1987 anni
8.235
-4.716
-36.41%
1 gen 1988 anni
13.309
+5.074
61.61%
1 gen 1989 anni
14.495
+1.186
8.91%
1 gen 1990 anni
17.989
+3.494
24.11%
1 gen 1991 anni
13.904
-4.085
-22.71%
1 gen 1992 anni
18.784
+4.88
35.1%
1 gen 1993 anni
19.956
+1.172
6.24%
1 gen 1994 anni
27.798
+7.842
39.3%
1 gen 1995 anni
27.84
+0.042
0.15%
1 gen 1996 anni
23.908
-3.932
-14.13%
1 gen 1997 anni
25.904
+1.997
8.35%
1 gen 1998 anni
25.0
-0.905
-3.49%
1 gen 1999 anni
27.583
+2.584
10.33%
1 gen 2000 anni
27.195
-0.389
-1.41%
1 gen 2001 anni
52.626
+25.432
93.52%
1 gen 2002 anni
28.235
-24.392
-46.35%
1 gen 2003 anni
28.108
-0.127
-0.45%
1 gen 2004 anni
33.395
+5.287
18.81%
1 gen 2005 anni
32.171
-1.224
-3.67%
1 gen 2006 anni
33.844
+1.673
5.2%
1 gen 2007 anni
28.141
-5.703
-16.85%
1 gen 2008 anni
47.692
+19.551
69.47%
1 gen 2009 anni
44.325
-3.367
-7.06%
1 gen 2010 anni
30.021
-14.304
-32.27%
1 gen 2011 anni
47.98
+17.958
59.82%
1 gen 2012 anni
38.271
-9.708
-20.23%
1 gen 2013 anni
37.69
-0.582
-1.52%
1 gen 2014 anni
39.096
+1.407
3.73%
1 gen 2015 anni
39.934
+0.838
2.14%
Classificazione dei paesi secondo i statistiche attuali per anni


Commenti: