29
/it/
it
AIzaSyAYiBZKx7MnpbEhh9jyipgxe19OcubqV5w
April 1, 2024
148207
Guyana
GUY
true
2
1
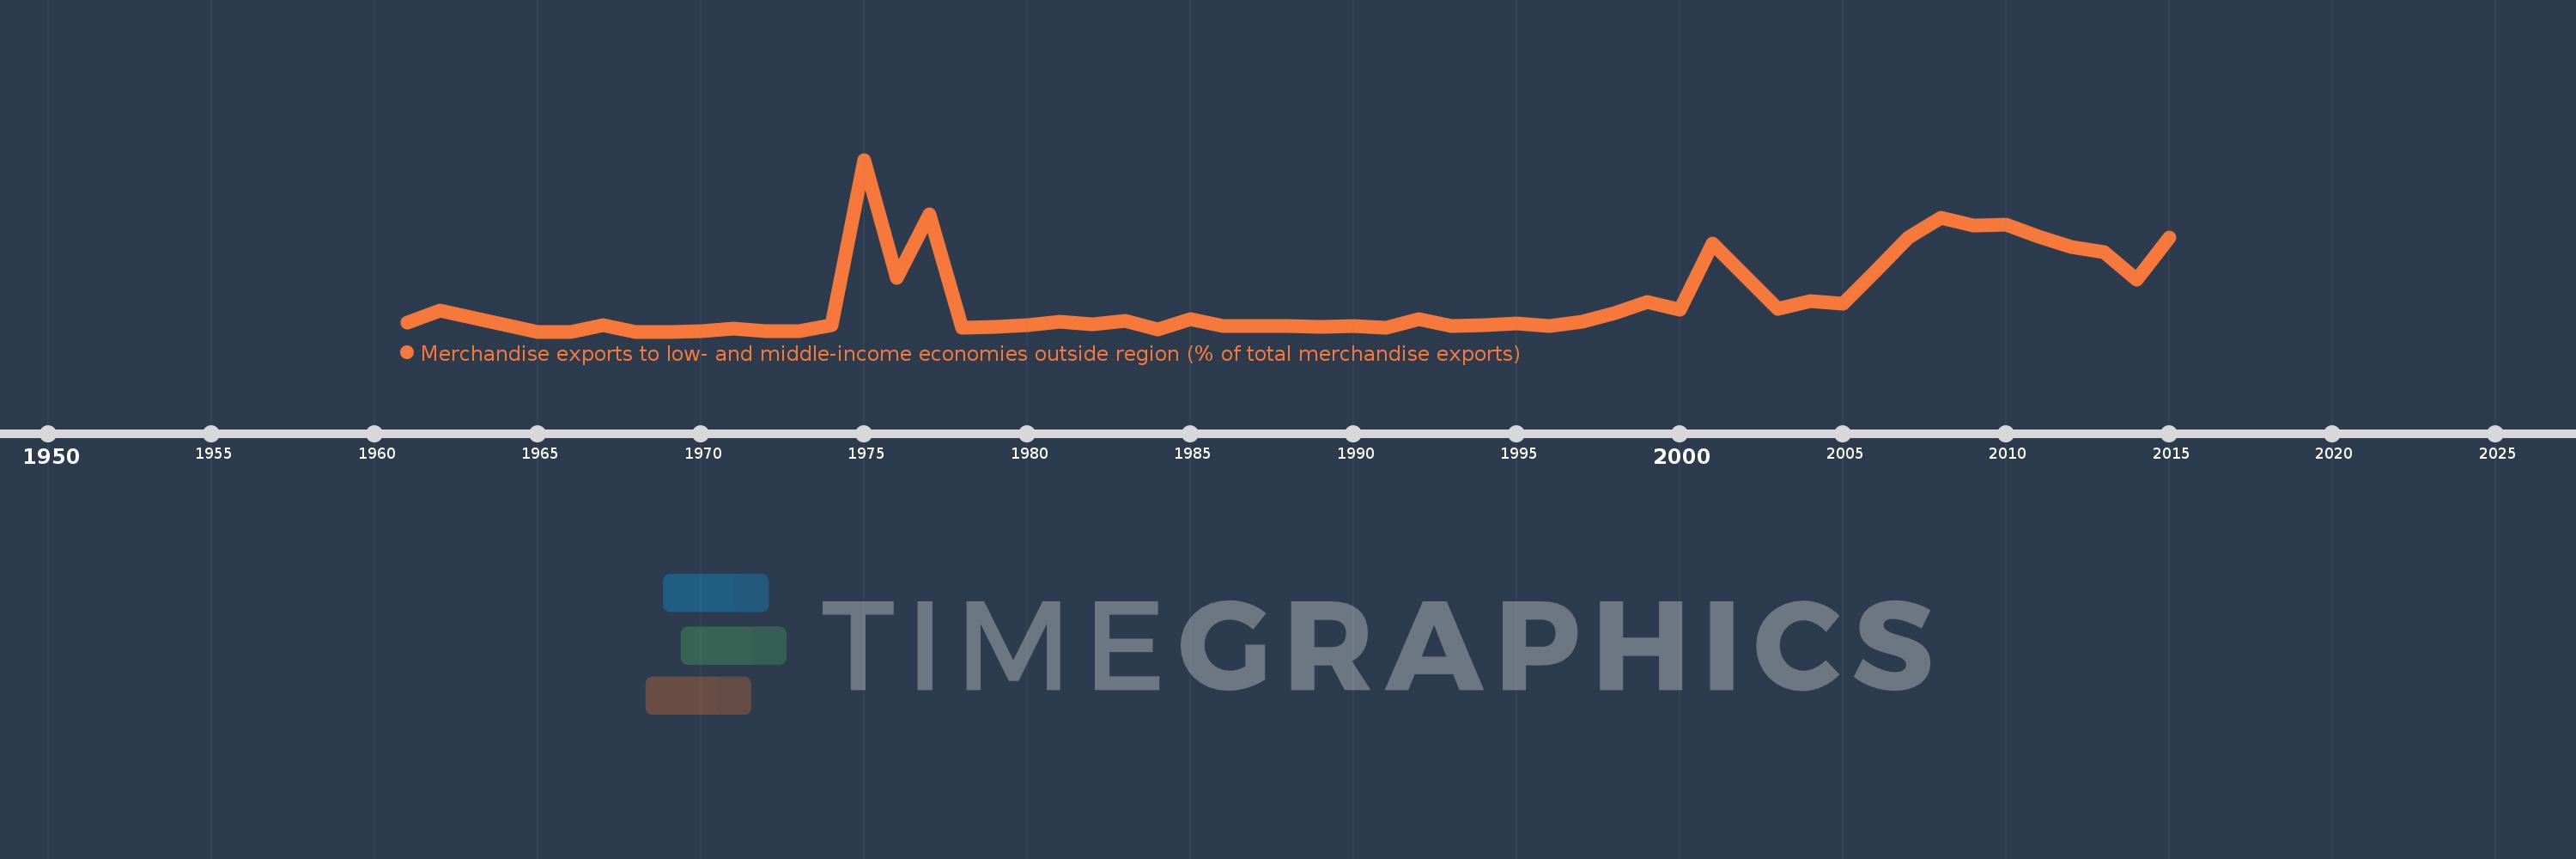
Merchandise exports to low- and middle-income economies outside region (% of total merchandise exports)
2015,2014,2013,2012,2011,2010,2009,2008,2007,2006,2005,2004,2003,2002,2001,2000,1999,1998,1997,1996,1995,1994,1993,1992,1991,1990,1989,1988,1987,1986,1985,1984,1983,1982,1981,1980,1979,1978,1977,1976,1975,1974,1973,1972,1971,1970,1969,1968,1967,1966,1965,1962,1961
Queste statistiche in altri paesi:
AfghanistanAlbaniaAlgeriaAngolaArab WorldArgentinaArmeniaArubaAustraliaAustriaAzerbaijanBahamas, TheBahrainBangladeshBarbadosBelarusBelgiumBelizeBeninBermudaBoliviaBrazilBrunei DarussalamBulgariaBurundiCabo VerdeCambodiaCameroonCanadaCaribbean small statesCentral African RepublicCentral Europe and the BalticsChileChinaColombiaCongo, Dem. Rep.Congo, Rep.Costa RicaCote d'IvoireCroatiaCubaCyprusCzech RepublicDenmarkDominicaDominican RepublicEarly-demographic dividendEast Asia & PacificEast Asia & Pacific (excluding high income)East Asia & Pacific (IDA & IBRD countries)EcuadorEgypt, Arab Rep.El SalvadorEstoniaEthiopiaEuro areaEurope & Central AsiaEurope & Central Asia (excluding high income)Europe & Central Asia (IDA & IBRD countries)European UnionFijiFinlandFragile and conflict affected situationsFranceGabonGambia, TheGeorgiaGermanyGhanaGreeceGreenlandGuatemalaGuineaGuyanaHaitiHeavily indebted poor countries (HIPC)High incomeHondurasHong Kong SAR, ChinaHungaryIBRD onlyIcelandIDA & IBRD totalIDA blendIDA onlyIDA totalIndiaIndonesiaIran, Islamic Rep.IraqIrelandIsraelItalyJamaicaJapanJordanKazakhstanKenyaKorea, Dem. People’s Rep.Korea, Rep.KuwaitLao PDRLate-demographic dividendLatin America & Caribbean Latin America & Caribbean (excluding high income)Latin America & the Caribbean (IDA & IBRD countries)LatviaLeast developed countries: UN classificationLebanonLiberiaLibyaLithuaniaLow & middle incomeLow incomeLower middle incomeLuxembourgMacao SAR, ChinaMacedonia, FYRMadagascarMalawiMalaysiaMaliMaltaMauritaniaMauritiusMexicoMiddle East & North AfricaMiddle East & North Africa (excluding high income)Middle East & North Africa (IDA & IBRD countries)Middle incomeMoldovaMongoliaMontenegroMoroccoMozambiqueMyanmarNetherlandsNew CaledoniaNew ZealandNicaraguaNigerNigeriaNorth AmericaNorwayOECD membersOmanOther small statesPacific island small statesPakistanPanamaPapua New GuineaParaguayPeruPhilippinesPolandPortugalPost-demographic dividendPre-demographic dividendQatarRomaniaRussian FederationRwandaSamoaSaudi ArabiaSenegalSerbiaSeychellesSierra LeoneSingaporeSlovak RepublicSloveniaSmall statesSomaliaSouth AfricaSouth AsiaSouth Asia (IDA & IBRD)SpainSri LankaSt. LuciaSt. Vincent and the GrenadinesSub-Saharan Africa Sub-Saharan Africa (excluding high income)Sub-Saharan Africa (IDA & IBRD countries)SudanSurinameSwedenSwitzerlandSyrian Arab RepublicTanzaniaThailandTogoTrinidad and TobagoTunisiaTurkeyUgandaUkraineUnited Arab EmiratesUnited KingdomUnited StatesUpper middle incomeUruguayVenezuela, RBVietnamWorldYemen, Rep.ZambiaZimbabwe Linea del tempo:
Questa scala temporale mostra un grafico dal 1961 anno al 2015 anno. Guyana. I dati fino ad 1960 anno non disponibili. Il numero di osservazioni attuali secondo i date: 53.
La fonte (nome):
Indicatori dello sviluppo mondiale
La fonte (organizzazione):
World Bank staff estimates based data from International Monetary Fund's Direction of Trade database.
Categorie:
Private Sector, Trade
sono stati aggiornati
23 apr 2017 anni
Indicatori delle variazioni dei valori per anni
Minima:
0.0
1 gen 1965 anni
Massimo:
12.89
1 gen 1975 anni
Alla data di osservazione
Valore
Variazione assoluta
La variazione rispetto al valore precedente
1 gen 1961 anni
0.673
+0.673
0.0%
1 gen 1962 anni
1.611
+0.938
139.4%
1 gen 1965 anni
0.0
-1.611
-100.0%
1 gen 1967 anni
0.458
+0.458
%
1 gen 1968 anni
0.0
-0.458
-100.0%
1 gen 1970 anni
0.011
+0.011
%
1 gen 1971 anni
0.229
+0.218
2.01 Mille.%
1 gen 1972 anni
0.048
-0.181
-79.18%
1 gen 1973 anni
0.012
-0.036
-74.84%
1 gen 1974 anni
0.489
+0.477
3.98 Mille.%
1 gen 1975 anni
12.89
+12.401
2.54 Mille.%
1 gen 1976 anni
4.034
-8.856
-68.7%
1 gen 1977 anni
8.8
+4.766
118.14%
1 gen 1978 anni
0.265
-8.535
-96.99%
1 gen 1979 anni
0.382
+0.117
44.12%
1 gen 1980 anni
0.499
+0.118
30.81%
1 gen 1981 anni
0.746
+0.246
49.33%
1 gen 1982 anni
0.522
-0.224
-30.01%
1 gen 1983 anni
0.827
+0.305
58.33%
1 gen 1984 anni
0.176
-0.65
-78.69%
1 gen 1985 anni
0.95
+0.774
439.08%
1 gen 1986 anni
0.396
-0.554
-58.31%
1 gen 1987 anni
0.396
+0.0
0.0%
1 gen 1988 anni
0.396
0.0
0.0%
1 gen 1989 anni
0.372
-0.023
-5.92%
1 gen 1990 anni
0.396
+0.023
6.29%
1 gen 1991 anni
0.283
-0.113
-28.48%
1 gen 1992 anni
0.906
+0.622
219.82%
1 gen 1993 anni
0.443
-0.463
-51.13%
1 gen 1994 anni
0.461
+0.019
4.25%
1 gen 1995 anni
0.605
+0.144
31.19%
1 gen 1996 anni
0.406
-0.199
-32.91%
1 gen 1997 anni
0.718
+0.312
76.88%
1 gen 1998 anni
1.393
+0.675
93.93%
1 gen 1999 anni
2.248
+0.855
61.41%
1 gen 2000 anni
1.622
-0.626
-27.86%
1 gen 2001 anni
6.634
+5.011
308.95%
1 gen 2002 anni
4.125
-2.508
-37.81%
1 gen 2003 anni
1.677
-2.449
-59.36%
1 gen 2004 anni
2.287
+0.61
36.41%
1 gen 2005 anni
2.066
-0.221
-9.66%
1 gen 2006 anni
4.532
+2.466
119.35%
1 gen 2007 anni
7.084
+2.552
56.32%
1 gen 2008 anni
8.548
+1.464
20.66%
1 gen 2009 anni
7.96
-0.589
-6.89%
1 gen 2010 anni
8.056
+0.096
1.21%
1 gen 2011 anni
7.146
-0.91
-11.3%
1 gen 2012 anni
6.348
-0.797
-11.16%
1 gen 2013 anni
5.937
-0.411
-6.48%
1 gen 2014 anni
3.882
-2.055
-34.61%
1 gen 2015 anni
7.051
+3.169
81.63%
Classificazione dei paesi secondo i statistiche attuali per anni


Commenti: