29
/it/
it
AIzaSyAYiBZKx7MnpbEhh9jyipgxe19OcubqV5w
April 1, 2024
78475
Bangladesh
BGD
true
2
1
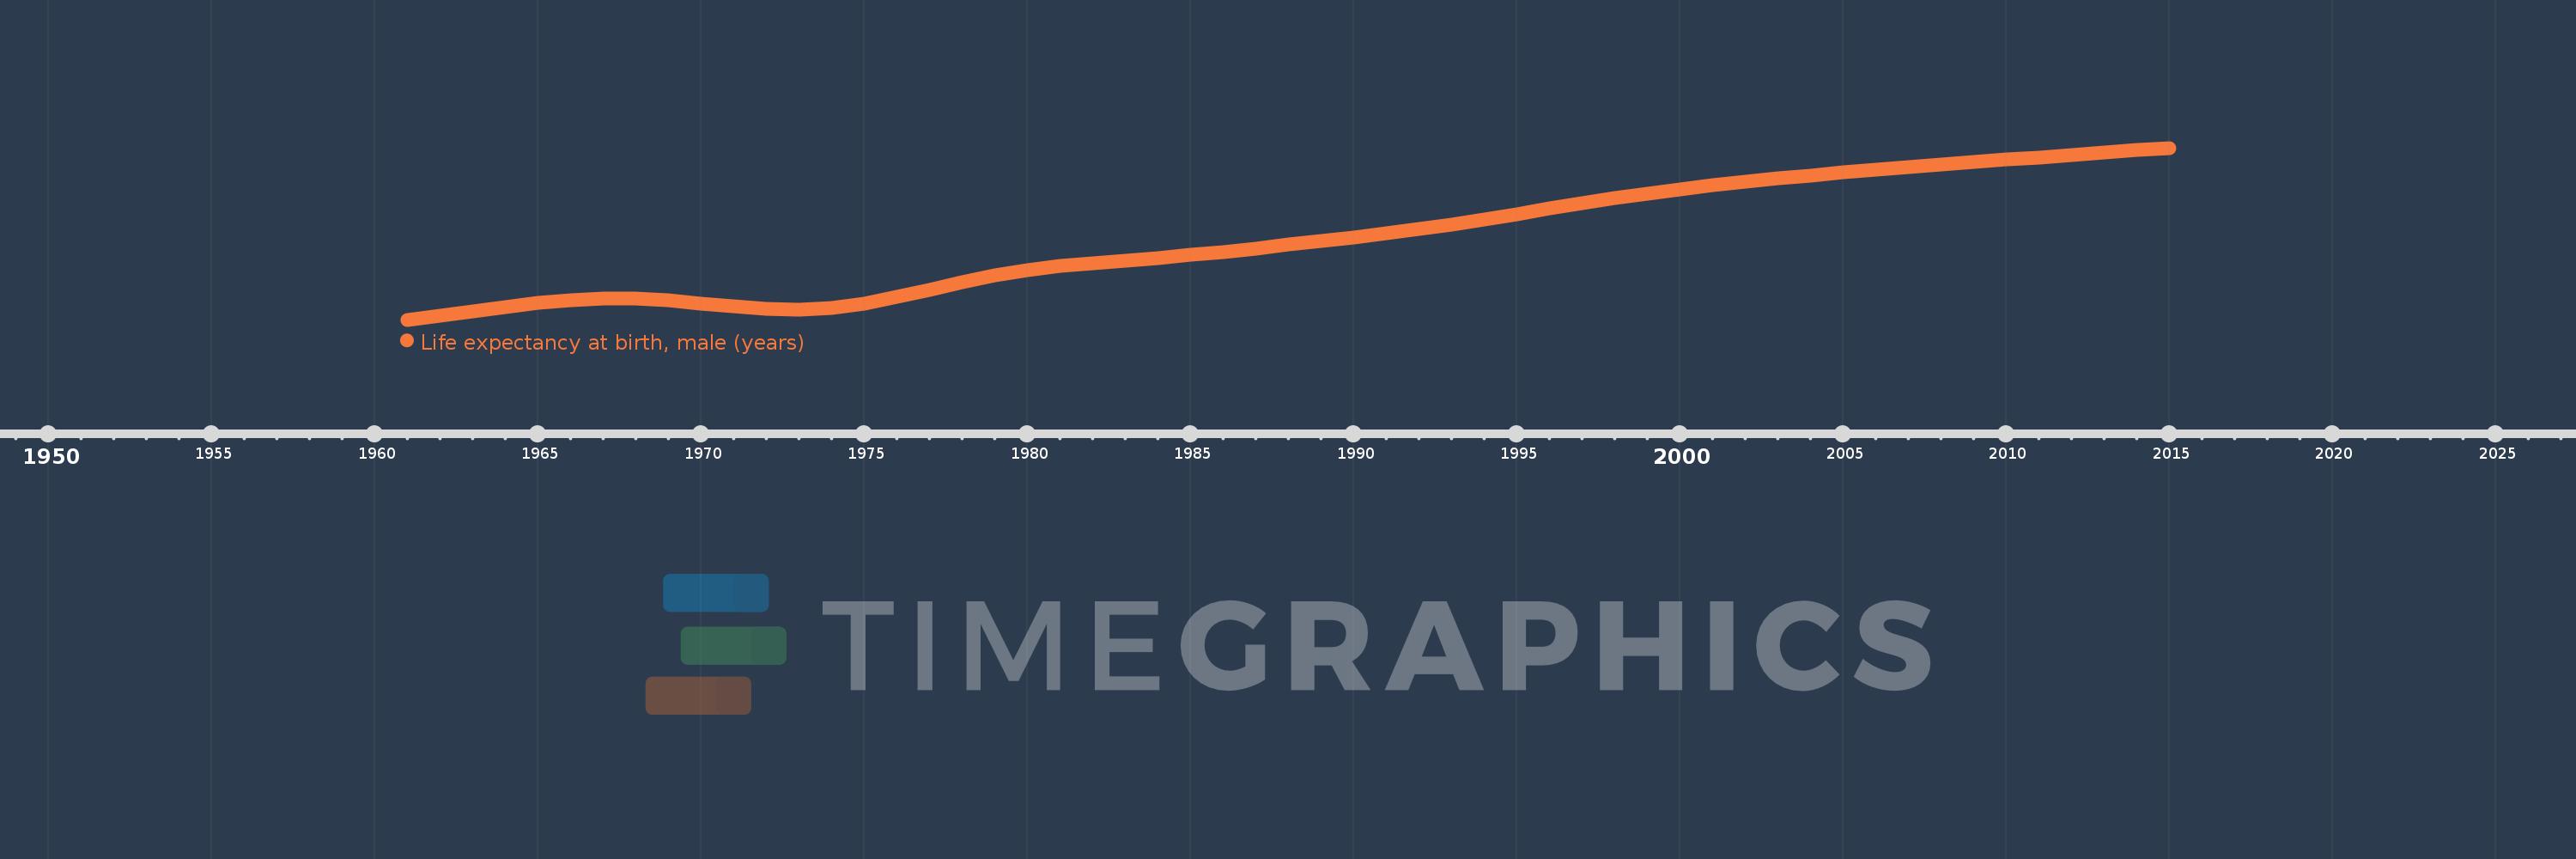
Life expectancy at birth, male (years)
2015,2014,2013,2012,2011,2010,2009,2008,2007,2006,2005,2004,2003,2002,2001,2000,1999,1998,1997,1996,1995,1994,1993,1992,1991,1990,1989,1988,1987,1986,1985,1984,1983,1982,1981,1980,1979,1978,1977,1976,1975,1974,1973,1972,1971,1970,1969,1968,1967,1966,1965,1964,1963,1962,1961
Queste statistiche in altri paesi:
AfghanistanAlbaniaAlgeriaAngolaAntigua and BarbudaArab WorldArgentinaArmeniaArubaAustraliaAustriaAzerbaijanBahamas, TheBahrainBangladeshBarbadosBelarusBelgiumBelizeBeninBermudaBhutanBoliviaBosnia and HerzegovinaBotswanaBrazilBrunei DarussalamBulgariaBurkina FasoBurundiCabo VerdeCambodiaCameroonCanadaCaribbean small statesCentral African RepublicCentral Europe and the BalticsChadChannel IslandsChileChinaColombiaComorosCongo, Dem. Rep.Congo, Rep.Costa RicaCote d'IvoireCroatiaCubaCuracaoCyprusCzech RepublicDenmarkDjiboutiDominicaDominican RepublicEarly-demographic dividendEast Asia & PacificEast Asia & Pacific (excluding high income)East Asia & Pacific (IDA & IBRD countries)EcuadorEgypt, Arab Rep.El SalvadorEquatorial GuineaEritreaEstoniaEthiopiaEuro areaEurope & Central AsiaEurope & Central Asia (excluding high income)Europe & Central Asia (IDA & IBRD countries)European UnionFaroe IslandsFijiFinlandFragile and conflict affected situationsFranceFrench PolynesiaGabonGambia, TheGeorgiaGermanyGhanaGreeceGreenlandGrenadaGuamGuatemalaGuineaGuinea-BissauGuyanaHaitiHeavily indebted poor countries (HIPC)High incomeHondurasHong Kong SAR, ChinaHungaryIBRD onlyIcelandIDA & IBRD totalIDA blendIDA onlyIDA totalIndiaIndonesiaIran, Islamic Rep.IraqIrelandIsle of ManIsraelItalyJamaicaJapanJordanKazakhstanKenyaKiribatiKorea, Dem. People’s Rep.Korea, Rep.KosovoKuwaitKyrgyz RepublicLao PDRLate-demographic dividendLatin America & Caribbean Latin America & Caribbean (excluding high income)Latin America & the Caribbean (IDA & IBRD countries)LatviaLeast developed countries: UN classificationLebanonLesothoLiberiaLibyaLiechtensteinLithuaniaLow & middle incomeLow incomeLower middle incomeLuxembourgMacao SAR, ChinaMacedonia, FYRMadagascarMalawiMalaysiaMaldivesMaliMaltaMarshall IslandsMauritaniaMauritiusMexicoMicronesia, Fed. Sts.Middle East & North AfricaMiddle East & North Africa (excluding high income)Middle East & North Africa (IDA & IBRD countries)Middle incomeMoldovaMongoliaMontenegroMoroccoMozambiqueMyanmarNamibiaNepalNetherlandsNew CaledoniaNew ZealandNicaraguaNigerNigeriaNorth AmericaNorwayOECD membersOmanOther small statesPacific island small statesPakistanPalauPanamaPapua New GuineaParaguayPeruPhilippinesPolandPortugalPost-demographic dividendPre-demographic dividendPuerto RicoQatarRomaniaRussian FederationRwandaSamoaSan MarinoSao Tome and PrincipeSaudi ArabiaSenegalSerbiaSeychellesSierra LeoneSingaporeSint Maarten (Dutch part)Slovak RepublicSloveniaSmall statesSolomon IslandsSomaliaSouth AfricaSouth AsiaSouth Asia (IDA & IBRD)South SudanSpainSri LankaSt. Kitts and NevisSt. LuciaSt. Martin (French part)St. Vincent and the GrenadinesSub-Saharan Africa Sub-Saharan Africa (excluding high income)Sub-Saharan Africa (IDA & IBRD countries)SudanSurinameSwazilandSwedenSwitzerlandSyrian Arab RepublicTajikistanTanzaniaThailandTimor-LesteTogoTongaTrinidad and TobagoTunisiaTurkeyTurkmenistanUgandaUkraineUnited Arab EmiratesUnited KingdomUnited StatesUpper middle incomeUruguayUzbekistanVanuatuVenezuela, RBVietnamVirgin Islands (U.S.)West Bank and GazaWorldYemen, Rep.ZambiaZimbabwe Linea del tempo:
Questa scala temporale mostra un grafico dal 1961 anno al 2015 anno. Bangladesh. I dati fino ad 1960 anno non disponibili. Il numero di osservazioni attuali secondo i date: 55.
La fonte (nome):
Indicatori dello sviluppo mondiale
La fonte (organizzazione):
(1) United Nations Population Division. World Population Prospects, (2) Census reports and other statistical publications from national statistical offices, (3) Eurostat: Demographic Statistics, (4) United Nations Statistical Division. Population and Vital Statistics Reprot (various years), (5) U.S. Census Bureau: International Database, and (6) Secretariat of the Pacific Community: Statistics and Demography Programme.
Categorie:
Health, Gender, Social Development
sono stati aggiornati
23 apr 2017 anni
Indicatori delle variazioni dei valori per anni
Minima:
45.522
1 gen 1961 anni
Massimo:
70.402
1 gen 2015 anni
Alla data di osservazione
Valore
Variazione assoluta
La variazione rispetto al valore precedente
1 gen 1961 anni
45.522
+45.522
0.0%
1 gen 1962 anni
46.155
+0.633
1.39%
1 gen 1963 anni
46.783
+0.628
1.36%
1 gen 1964 anni
47.391
+0.608
1.3%
1 gen 1965 anni
47.953
+0.562
1.19%
1 gen 1966 anni
48.391
+0.438
0.91%
1 gen 1967 anni
48.612
+0.221
0.46%
1 gen 1968 anni
48.584
-0.028
-0.06%
1 gen 1969 anni
48.325
-0.259
-0.53%
1 gen 1970 anni
47.893
-0.432
-0.89%
1 gen 1971 anni
47.422
-0.471
-0.98%
1 gen 1972 anni
47.082
-0.34
-0.72%
1 gen 1973 anni
47.007
-0.075
-0.16%
1 gen 1974 anni
47.276
+0.269
0.57%
1 gen 1975 anni
47.895
+0.619
1.31%
1 gen 1976 anni
48.803
+0.908
1.9%
1 gen 1977 anni
49.877
+1.074
2.2%
1 gen 1978 anni
50.953
+1.076
2.16%
1 gen 1979 anni
51.903
+0.95
1.86%
1 gen 1980 anni
52.679
+0.776
1.5%
1 gen 1981 anni
53.27
+0.591
1.12%
1 gen 1982 anni
53.709
+0.439
0.82%
1 gen 1983 anni
54.086
+0.377
0.7%
1 gen 1984 anni
54.472
+0.386
0.71%
1 gen 1985 anni
54.892
+0.42
0.77%
1 gen 1986 anni
55.357
+0.465
0.85%
1 gen 1987 anni
55.863
+0.506
0.91%
1 gen 1988 anni
56.392
+0.529
0.95%
1 gen 1989 anni
56.93
+0.538
0.95%
1 gen 1990 anni
57.482
+0.552
0.97%
1 gen 1991 anni
58.06
+0.578
1.01%
1 gen 1992 anni
58.681
+0.621
1.07%
1 gen 1993 anni
59.352
+0.671
1.14%
1 gen 1994 anni
60.071
+0.719
1.21%
1 gen 1995 anni
60.827
+0.756
1.26%
1 gen 1996 anni
61.603
+0.776
1.28%
1 gen 1997 anni
62.372
+0.769
1.25%
1 gen 1998 anni
63.113
+0.741
1.19%
1 gen 1999 anni
63.805
+0.692
1.1%
1 gen 2000 anni
64.437
+0.632
0.99%
1 gen 2001 anni
65.007
+0.57
0.88%
1 gen 2002 anni
65.517
+0.51
0.78%
1 gen 2003 anni
65.985
+0.468
0.71%
1 gen 2004 anni
66.426
+0.441
0.67%
1 gen 2005 anni
66.845
+0.419
0.63%
1 gen 2006 anni
67.246
+0.401
0.6%
1 gen 2007 anni
67.631
+0.385
0.57%
1 gen 2008 anni
67.999
+0.368
0.54%
1 gen 2009 anni
68.352
+0.353
0.52%
1 gen 2010 anni
68.695
+0.343
0.5%
1 gen 2011 anni
69.032
+0.337
0.49%
1 gen 2012 anni
69.37
+0.338
0.49%
1 gen 2013 anni
69.711
+0.341
0.49%
1 gen 2014 anni
70.055
+0.344
0.49%
1 gen 2015 anni
70.402
+0.347
0.5%
Classificazione dei paesi secondo i statistiche attuali per anni


Commenti: